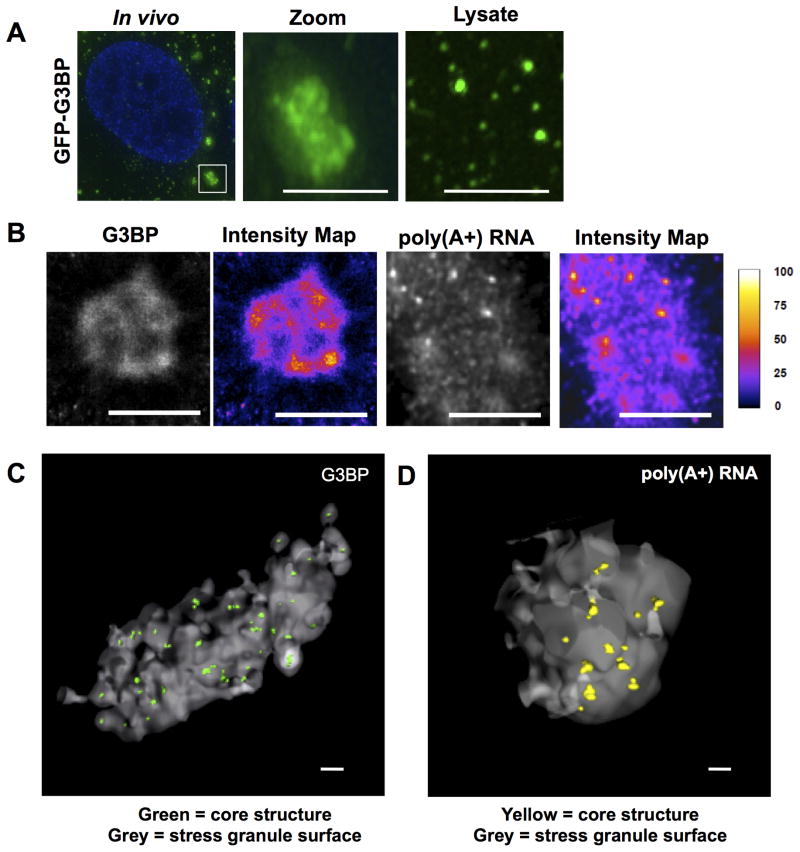
Figure 2. Super Resolution Microscopy of Mammalian Stress Granules.
(A) Comparison of size between granules in vivo and GFP-G3BP foci in lysates. Middle panel shows zoomed inset. Third panel shows foci in lysate. Scale bars are 2μm. (B) STORM images of stress granules in vivo, showing IF for GFP-G3BP (Alexa647-αGFP) and FISH for poly(A+) RNA (Alexa647-oligo(dT). Intensity map represents relative grey scale intensity. Scale bars represent 2μm. (C) 3D STORM image of a stress granule in vivo, showing IF for GFP-G3BP (Alexa647-αGFP). Grey surface represents surface of a stress granule. Cores are shown in green. Scale bar represents 500nm. (D) 3D STORM image of a stress granule in vivo for poly(A+) RNA (Alexa647-oligo(dT). Grey surface represents surface of a stress granule. Cores are shown in yellow. Scale bar represents 500nm. See also Figure S2 and Movie S1.

