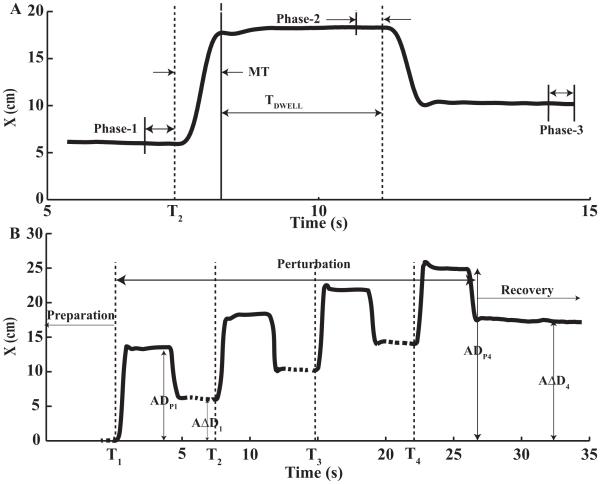
Figure 2.
A: The hand trajectory during the second perturbation episode within a Quad-Perturbation trial. The data are for a typical trial performed by a representative subject. Three Phases are shown where the data were extracted. B: A typical hand trajectory along the x-axis showing all four perturbation episodes within a Quad-Perturbation trial. ADPi and AΔDi are the accumulated perturbation distance and undershoot distance after the ith perturbation. The dashed part of the trajectory is the rest between two successive perturbation episodes.

