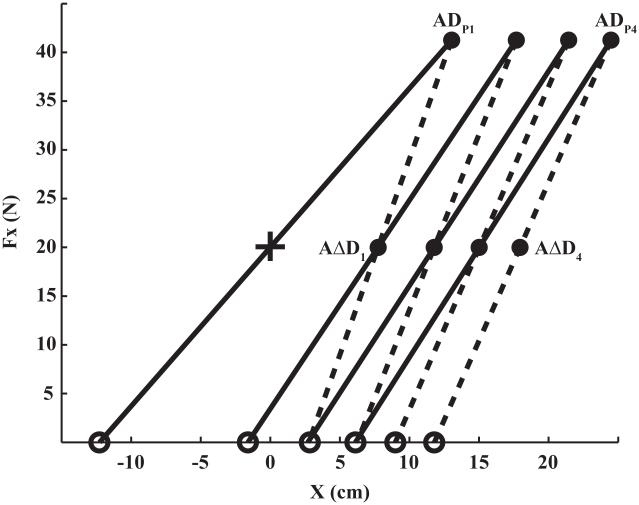
Figure 5.
The equilibrium positions of the hand are shown on the force-coordinate (Fx vs. x) plane. The initial equilibrium position of the hand is shown with the cross. Black dots represent mean equilibrium positions averaged across subjects while the referent hand positions are shown as open circles. An increase in force led to the hand motion to a new coordinate, ADPi (i = 1, 2, 3, 4). After the dwell time, the force returned back to its initial value, and the hand moved to a new, intermediate position, AΔDi. The slope of the straight lines represents the apparent stiffness of the arm. The solid lines represent the apparent stiffness before dwell time while the dashed lines the apparent stiffness after dwell time. After the dwell time, the apparent stiffness increases as shown by the steeper lines. The referent hand coordinate drifts towards the trunk during the rest period between two perturbation episodes.

