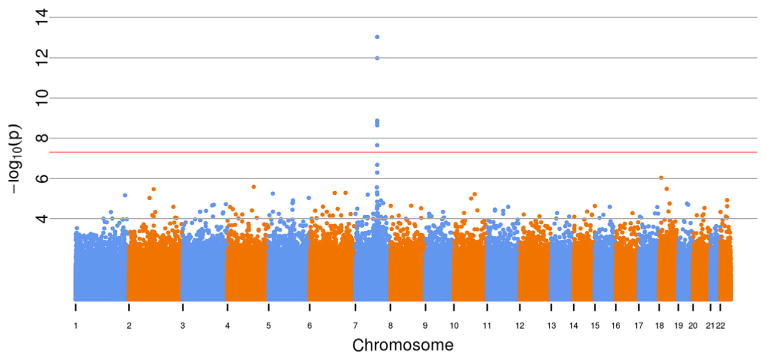
Figure 1. Manhattan plot of single-nucleotide polymorphisms (SNPs) associated with tacrolimus trough concentrations.

Overall, 644 224 SNPs were analyzed toward natural log of dose-normalized tacrolimus trough concentrations (nanograms per milliliter per total daily dose in milligrams) with no additional covariates. All SNPs are shown in order from chromosome 1 to 22. The red line is at the level of statistical significance (p < 5 × 10⁻⁸). The major peak is above the CYP3A locus.
