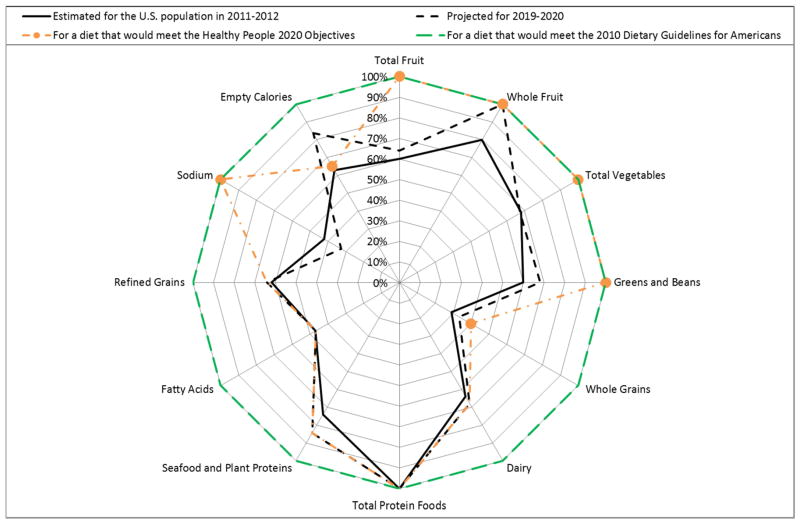
Figure 2.
Mean Healthy Eating Index-2010 component scoresa: estimated for the U.S. population in 2011–2012; projected for 2019–2020; for a diet that would meet Healthy People 2020 objectivesb; and for a diet that would meet the 2010 Dietary Guidelines for Americans.
aEach component score is scaled as a percentage of the maximum score for that component.
bThe component scores with respective Healthy People targets are denoted with a circular marker; the component scores that were imputed from the 2019–2020 projection do not have a marker.
cData source: National Health and Nutrition Examination Survey, 1999–2000 to 2011–2012

