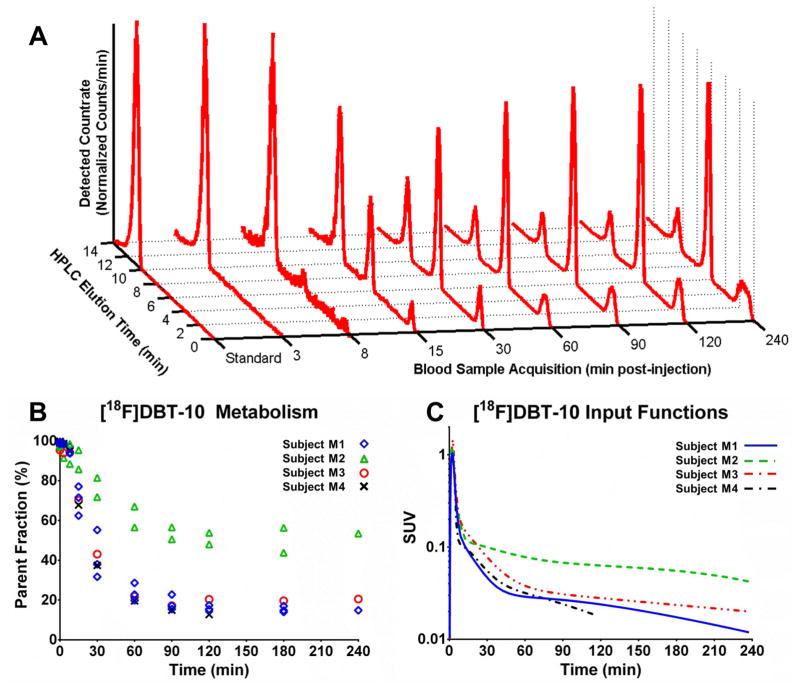
Figure 3.
[18F]DBT-10 in the arterial plasma. A. Radio-HPLC traces for subject M1’s baseline scan, with [18F]DBT-10 at ~11 min and metabolites at ~1 min and ~7 min. B. Measured [18F]DBT-10 parent fractions for all acquired scans. The three subjects are identified by separate symbols; M1: ⋄, M2: △,M3:○, M4:×. C. [18F]DBT-10 input functions for all baseline scans, in units of SUV (activity normalized by injected dose and subject weight). The three subjects are identified by separate lines: M1, solid; M2, dashed; M3, dash-dot, red; M4, dash-dot, black.

