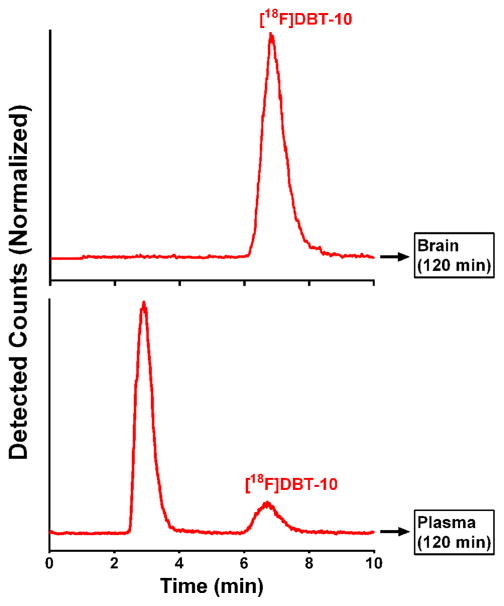
Figure 4.
Ex vivo metabolite analysis of [18F]DBT-10 in brain and blood showing typical HPLC traces of radioactivity from extracted brain tissue (hippocampus) (top), and from an arterial plasma sample drawn immediately prior to animal sacrifice (bottom). For the plasma sample, t=0 represents the beginning of back-flush from the capture column.

