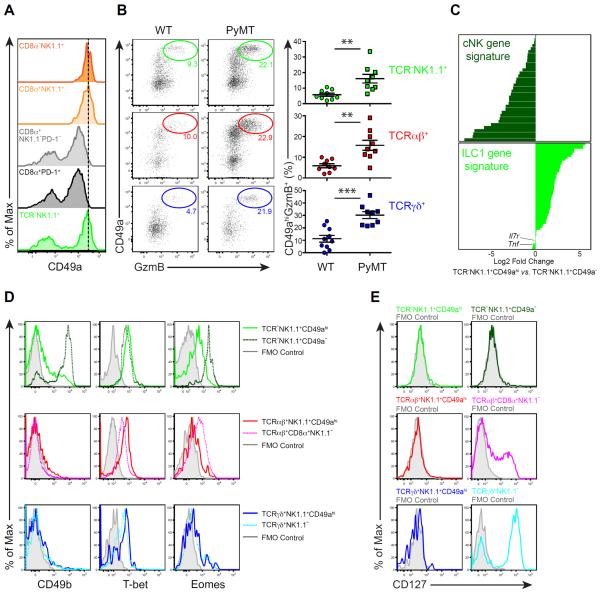
Figure 3. Tumor-associated GzmB-expressing innate lymphocytes are type 1-like ILCs (ILC1ls).
(A) Flow cytometric analysis of CD49a expression in the indicated cell populations isolated from pooled tumors of 20- to 24-week-old PyMT mice. CD8α−NK1.1+, CD8α+NK1.1+, CD8α+NK1.1−PD-1− and CD8α+PD-1+ cell subsets were gated among TCRβ+ cells. Data are representative of ten independent experiments.
(B) Left panel: flow cytometric analysis of CD49a and GzmB expression in the indicated subsets isolated from pooled mammary glands of wild-type (WT) and 8-week-old PyMT mice. Data are representative of five independent experiments. Right panel: percentages of CD49ahiGzmB+ cells in the indicated subsets (determined by flow cytometric analysis as in the left panel). Each symbol denotes an individual mouse. Data are pooled from five independent experiments. Error bars represent the mean ± SEM. Two-tailed unpaired t-test was used for statistical analysis. **P<0.01, ***P<0.001.
(C) Log2 mean fold change of TCR−NK1.1+CD49ahi vs. TCR−NK1.1+CD49a− gene expression corresponding to the cNK and ILC1 core gene signatures. See also Table S2.
(D–E) Flow cytometric analysis of CD49b, T-bet and Eomes (D) as well as CD127 (E) expression in the indicated cell populations isolated from pooled tumors of 20- to 24-week-old PyMT mice. Grey histogram indicates fluorescence minus one (FMO) control. Data are representative of three independent experiments.
See also Figure S3.

