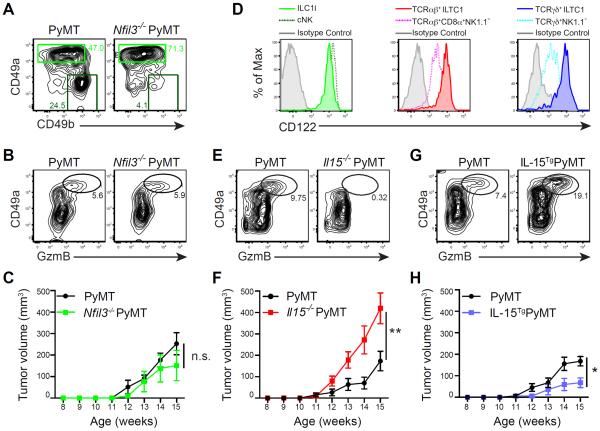
Figure 7. IL-15 regulates ILC1l and ILTC1 generation impacting on tumor growth.
(A) Flow cytometric analyses of CD49a and CD49b expression in TCR−NK1.1+ cells from pooled tumors of Nfil3−/− PyMT and wild-type PyMT mice. Numbers in plots indicate percentage of CD49ahiCD49b− (ILC1l) and CD49a−CD49b+ (cNK) cells in their respective gates. Data are representative of three independent experiments.
(B) Flow cytometric analysis of CD49a and GzmB expression in CD45+ leukocytes from pooled tumors of Nfil3−/− PyMT and wild-type PyMT mice. Numbers in plots indicate percentage of CD49ahiGzmB+ cells. Data are representative of three independent experiments.
(C) Total tumor burden of Nfil3−/− PyMT and wild-type PyMT mice monitored between 8 and 15 weeks of age (n = 3–6).
(D) Flow cytometric analysis of CD122 expression in the indicated cell populations isolated from pooled mammary glands of 8-week-old PyMT mice. Data are representative of five independent experiments.
(E) Flow cytometric analysis of CD49a and GzmB expression in CD45+ leukocytes isolated from pooled mammary glands of 8-week-old Il15−/− PyMT and wild-type PyMT mice. Numbers in plots indicate percentage of CD49ahiGzmB+ cells.
(F) Total tumor burden of Il15−/− PyMT and wild-type PyMT mice monitored between 8 and 15 weeks of age (n = 14–17).
(G) Flow cytometric analysis of CD49a and GzmB expression in CD45+ leukocytes isolated from pooled mammary glands of 8-week-old IL-15TgPyMT and wild-type PyMT mice. Numbers in plots indicate percentage of CD49ahiGzmB+ cells.
(H) Total tumor burden of IL-15TgPyMT and wild-type PyMT mice monitored between 8 and 15 weeks of age (n = 11–15).
(C, F, H) Error bars represent the mean ± SEM. Two-way ANOVA was used for statistical analysis. n.s. = not significant, *P<0.05, **P<0.01.
See also Figure S7.

