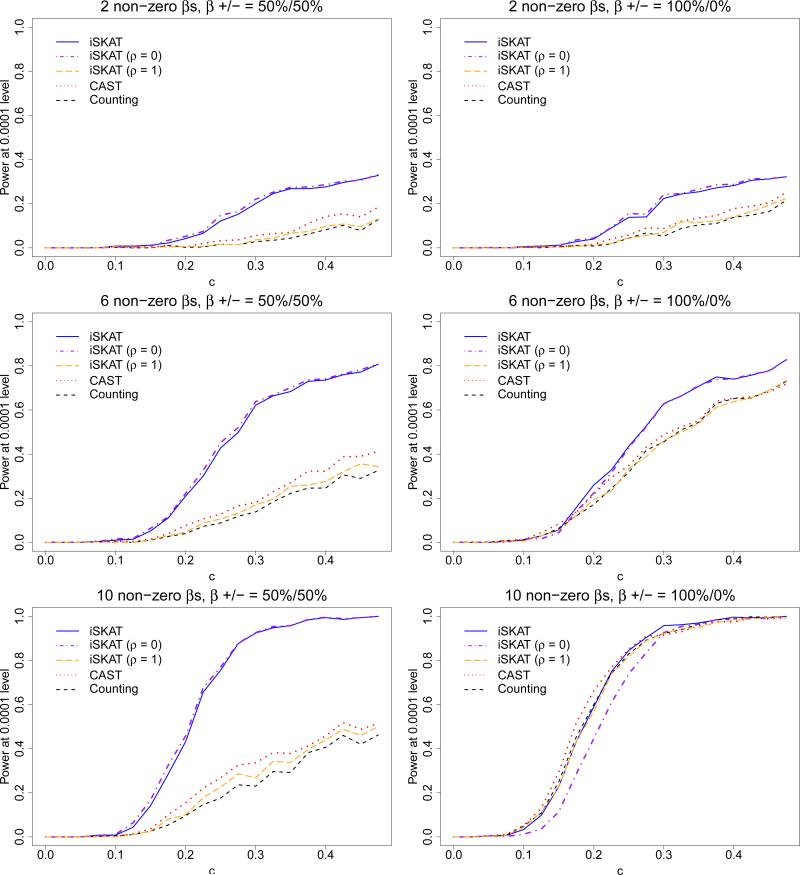
Figure 1.
Empirical power curves for n = 1945 at α = 0.0001 level of significance for testing rare variant GE interaction effects on a continuous outcome when there are no main effects - iSKAT (solid line), iSKAT with ρ = 0 (dashed-and-dotted line), iSKAT with ρ = 1 (long dashed line), CAST (dotted line) and Counting (short dashed line). Top panel - 2 non-zero βj's; Middle panel - 6 non-zero βj's; Bottom panel - 10 non-zero βj's. Left panel - 50% of βj's are positive; Right panel -100% of βj's are positive. In each plot, we set the magnitudes of the non-zero βj's as |βj| = c, and increased c from zero until 0.475. Datasets were generated by sampling the genotypes and covariates jointly with replacement from the CoLaus dataset to preserve the association between G and E. Note that the p-value for the association between G and E in the CoLaus dataset was 0.042, which suggests plausible G – E dependence.

