
Figure 1. Single-cell Neurexin transcriptional profiles are distinct from those observed in tissue samples.
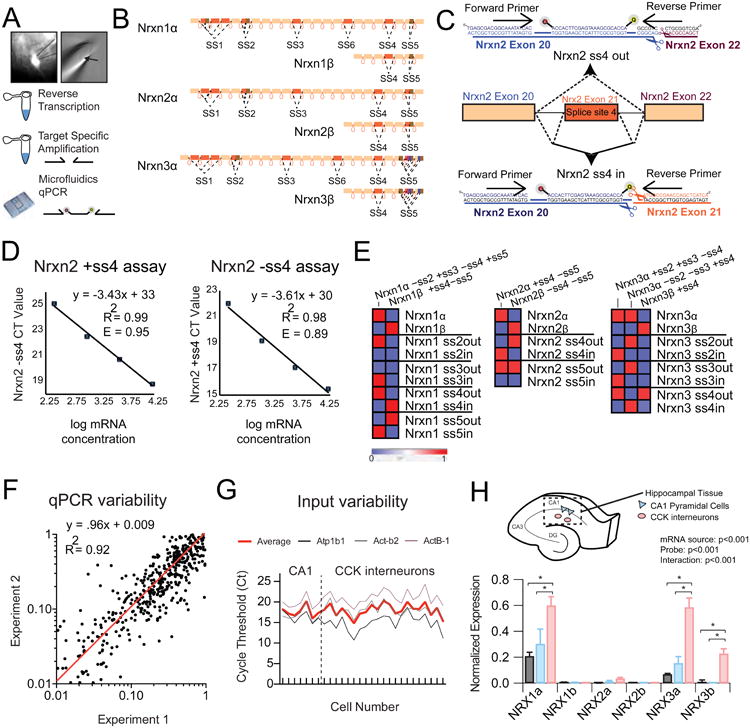
(A) Left: Image of 40x fluorescent field showing pipette extraction (solid outline) of GFP+ positive cell (dotted outline) from adult striatum. Right: Cellular contents and nucleus (arrow) within the extraction pipette. Bottom: General workflow from single cell extraction to target specific amplification of reverse-transcribed cDNA.
(B) Schematic depicting the genomic architecture of Nrxn1-3.
(C) An example strategy for the design of Nrxn2 ss4-specific primers is shown, which employs common forward primer and internal probe with unique reverse primer to differentiate inclusion or skipping of exon 21.
(D) Primer efficiency determination through plotting of cycle threshold (Ct) versus mRNA concentration in serial dilution.
(E) Heat map representation of cycle threshold for plasmid DNA with known splice-site content.
(F) Measurement of trial-to-trial qPCR variability (experiment 1 versus experiment 2) for all probes across single cell cDNAs (n=24) demonstrates a near linear fit (red line).
(G) Assessment of input variability for CA1 pyramidal cells and CCK+ interneurons by plotting of cycle threshold for 3 normalization probes across all collected single cells (3 probe average=red).
(H) Top: Schematic depicting mRNA isolation from hippocampal CA1 field for transcriptional analysis of hippocampal tissue (n=6) and individual CA1 pyramidal cells (n=7) or stratum radiatum CCK interneurons (n=22). (Bottom) Averaged normalized expression for the long and short neurexin transcriptional isoforms for hippocampal tissue and single cell populations.
Data are means + SEM; *significant difference between groups (ANOVA) with Tukey's multiple comparison post-hoc test.