
Figure 2. Hippocampal interneurons exhibit cell-type specific neurexin expression patterns.
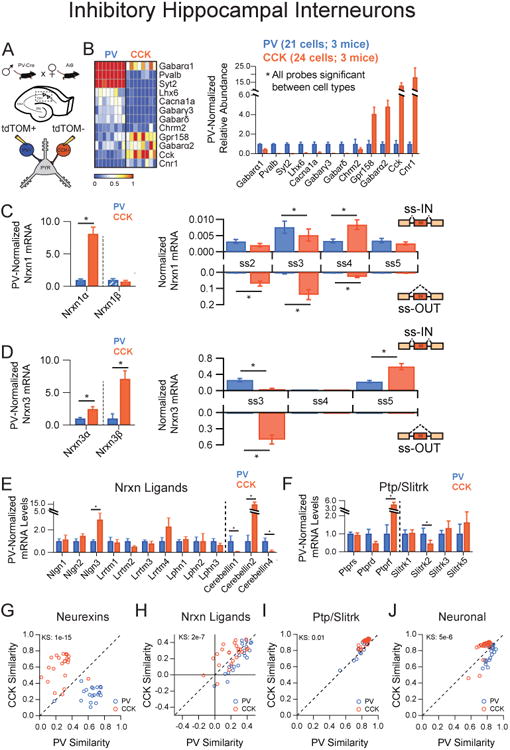
(A) Illustration of the genetic cross employed to label hippocampal interneurons for pipette extraction.
(B) Left: Heat map representation of normalized expression of PV+ and CCK+ interneurons for genes known to mark these subtypes. Right: Averaged single cell normalized expression for PV+ (n=21) and CCK+ (n=24).
(C,D) Left: Nrxn α/β isoform expression, normalized to the average level in PV+ cells (hatched PV bars designate expression value <1%). Right: Splice site graph showing averaged single cell splice isoform expression values for ss-IN (upward bars) and ss-OUT (downward bars).
(E,F) Averaged single cell normalized expression values for neurexin ligands (E, dotted line separates putative postsynaptic and secreted protein products) and the Ptp/Slitrk family (F, dotted line separates receptors from putative postsynaptic ligands).
(G-J) Pearson coefficient correlation plots demonstrating the similarity of individual neurons to the two cell classes being compared for neurexin (G), neurexin ligands (H), Ptp/Slitrk family (I) and general neuronal transcripts (J). Cells are color coded according to their known genetic identity. The dashed unity line represents cells that are equally similar to both cell types.
Data are means + SEM; *significant difference between groups (Mann Whitney U-test). Kolmogorav-Smirnov (KS) values are given for comparison of single cell groups in G-J.