
Figure 3. Nucleus accumbens medium spiny neurons exhibit cell-type specific neurexin expression patterns.
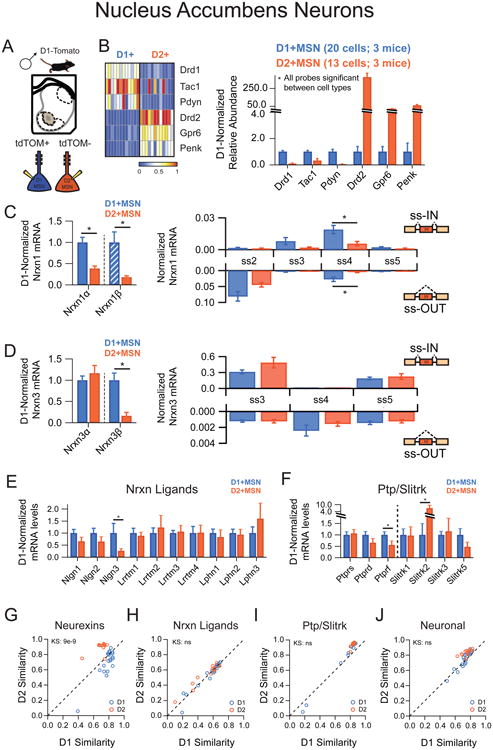
(A) Illustration of picking strategy to isolate D1R+ and D2R+ MSN subtypes
(B) Left: Heat map representation of normalized expression of D1R+ and D2R+ MSNs for genes known to mark these subtypes. Right: Averaged single cell normalized expression for D1R+ (n=20) and D2R+ (n=13).
(C,D) Left: Nrxnα/β isoform expression, normalized to the average level in D1R+ cells (hatched D1+MSN bars designate expression value <1%). Right: Splice site graph showing averaged single cell splice isoform expression values for ss-IN (upward bars) and ss-OUT (downward bars).
(E,F) Averaged single cell normalized expression values for neurexin ligands (E) and the Ptp/Slitrk family (F).
(G-J) Pearson coefficient correlation plots demonstrating the similarity of individual neurons to the two cell classes being compared for neurexins (G), neurexin ligands (H), Ptp/Slitrk family (I) and general neuronal transcripts (J). Cells are color coded according to D1R+ and D2R+ identity.
Data are means + SEM; *significant difference between groups (Mann Whitney U-test). Kolmogorav-Smirnov (KS) values are given for comparison of single cell groups in G-J.