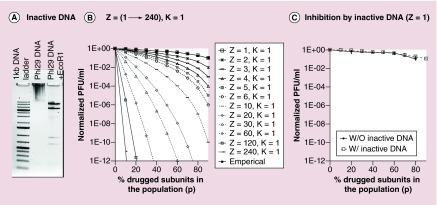
Figure 2. . Theoretical plot (with variable Z) and empirical data to illustrate inhibition efficiency with drug targeting to genomic DNA (Z-1).
(A) Gel showing the phi29 genome DNA treated with endonuclease EcoR1. (B) Plot of virion assembly derived from binomial distribution Equation 2, which showed that the DNA has stoichiometry of 1. (C) Viral assembly inhibition effect of mutant DNA as model of drugged component with Z = 1, showing the linear relationship to p with low slope.
W: With; W/O: Without.

