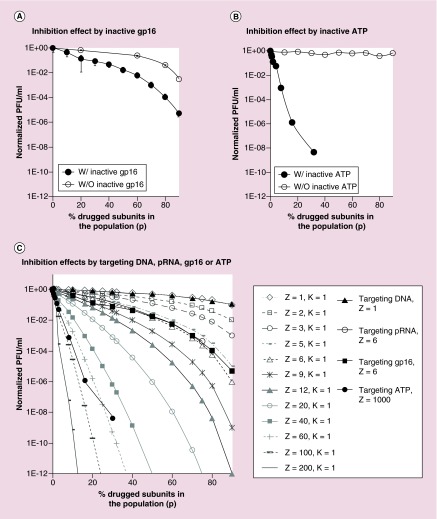
Figure 5. . Comparision of inhibition efficiency using targets with different Z values.
(A) Virion production inhibition effect of mutant gp16 (Z = 6) at different concentration. (B) Inhibition efficiency by γ-s-ATP with ATP with high Z value. (C) Comparing the virus assembly inhibition effect by drugged components of DNA, pRNA, gp16 and ATP with stoichiometry of 1, 6, 6 and 10,000, respectively.
W: With; W/O: Without.

