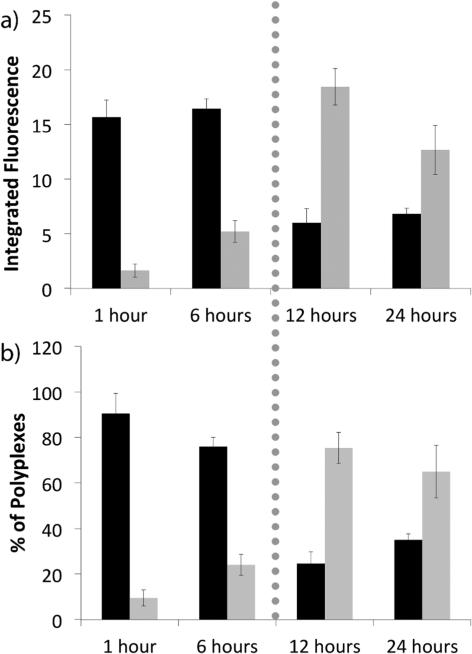
Figure 2.
Nuclear vs. non-nuclear accumulation of H3-targeted polyplexes. (a) Integrated fluorescence calculations were used to determine the quantity of importin-4-colocalized polyplexes in the non-nuclear regions of the cell (black) or within the nucleus (grey). Integrated fluorescence was calculated using the area of the polyplex grouping and the mean intensity of the grouping, using ImageJ software. (b) Percentages of importin-4-colocalized polyplexes in the nucleus (grey) vs. non-nuclear regions of the cell (black). The dotted line represents the approximate time of mitosis. Each data bar represents the mean ± SE, with a minimum of 80-100 polyplex groupings analyzed per bar.

