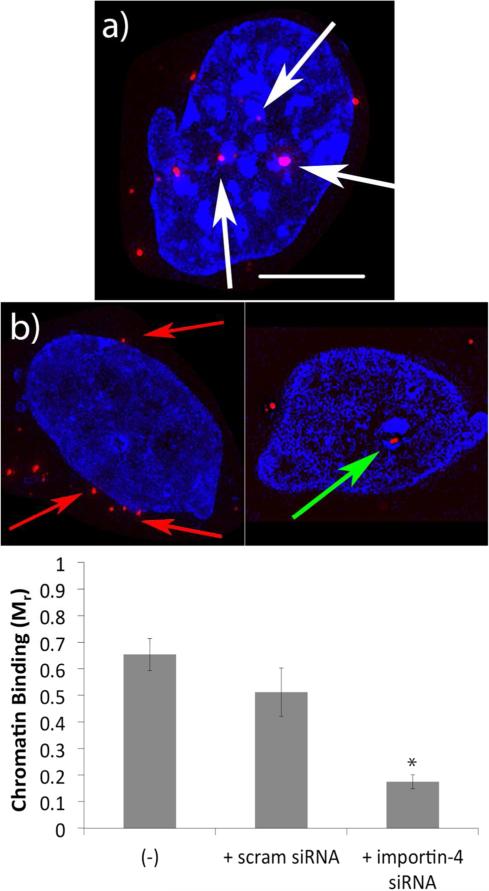
Figure 7.
Super resolution imaging experiments of H3-targeted polyplex binding to chromatin. Representative images of chromatin (blue) binding by the H3-targeted polyplexes (red) when cells were treated with scrambled importin-4 siRNA (a), and representative images showing the lack of H3-targeted polyplex binding to chromatin when cells were treated with importin-4 siRNA (b). The scale bar (shown in a) = 5 μm. Chromatin was stained with DAPI. White arrows indicate chromatin binding, green arrows represent the lack of chromatin binding by nuclear polyplexes when importin-4 was inhibited, and red arrows indicate those polyplexes that remained largely in the nuclear periphery with importin-4 inhibition. (c) Quantification of chromatin binding using Manders’ coefficients at 12 h post-transfection. Ten images containing 8–10 cells per image were analyzed for each sample.

