
Figure 1.
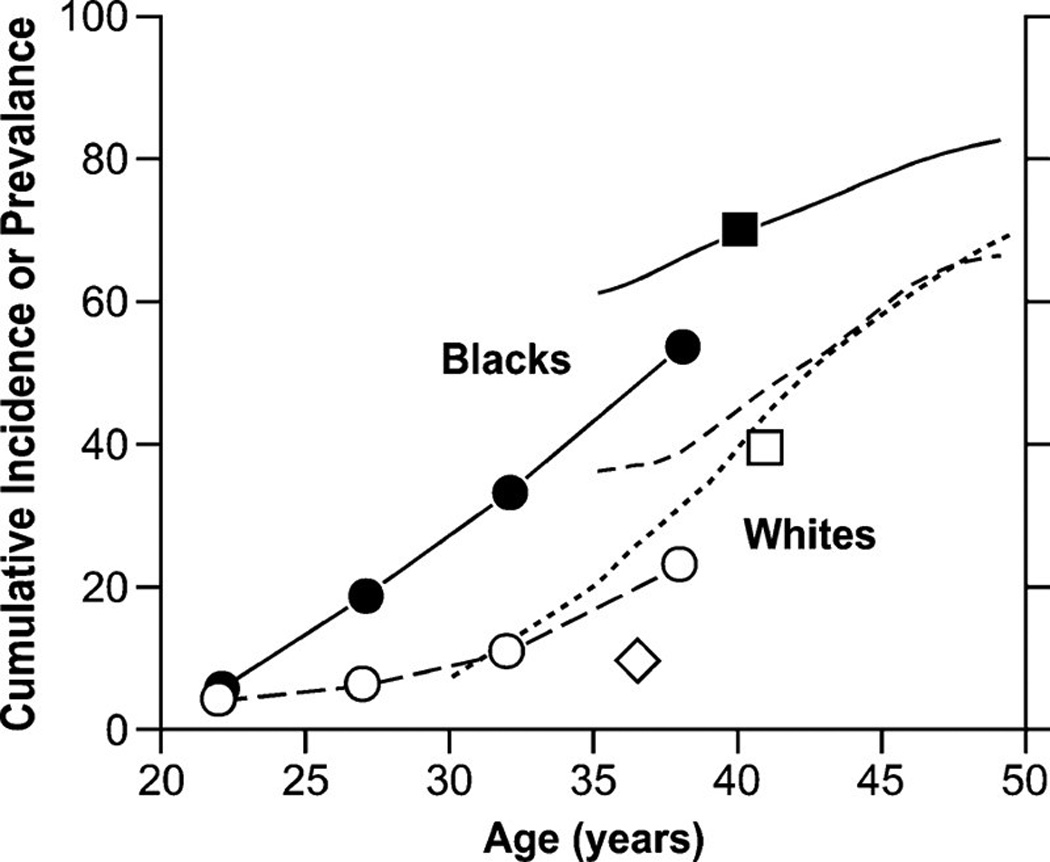
Age-specific cumulative incidence or prevalence estimates of uterine leiomyomata based on ultrasound-screening studies. The closed and open circles are prevalence data averaged over the age ranges shown for black and white women participating in Right from the Start [82], a community-based pregnancy study that screens for leiomyomata at ~7 weeks of gestation. The solid line and line of long dashes are cumulative incidence data from the UFS [14] a study of 35- to 49-year-old health plan members whose case status was based on either ultrasound screening for uterine leiomyomata (premenopausal women) or on prior diagnosis of uterine leiomyomata (postmenopausal women). The line of short dashes is cumulative incidence data from the low-exposed group of potentially dioxin-exposed women (Seveso, Italy) [9, 26, 87], 30- to 50-year-olds whose case status was based on either ultrasound screening for uterine leiomyomata (premenopausal women) or on prior diagnosis of uterine leiomyomata (postmenopausal women). The squares are average cumulative incidence data for samples of 33- to 46-year-old black and white participants in the Coronary Artery Risk Development in Young Adults study [25], a population-based study of cardiovascular disease. The diamond is the average prevalence of uterine leiomyomata for a group of 33- to 40-year-old representative Swedish women who had ultrasound screening for uterine leiomyomata [15].