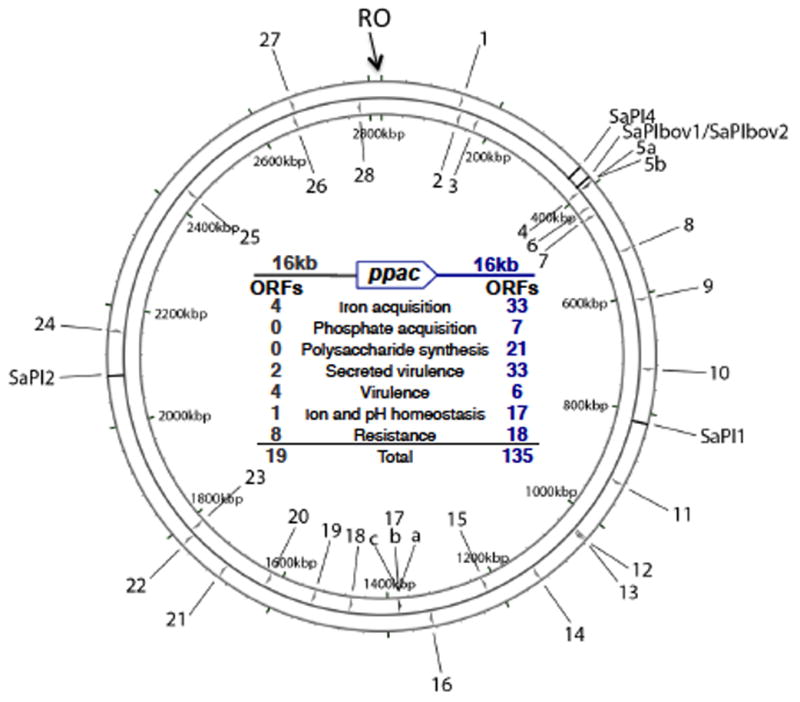
Fig. 4. S. aureus strain NCTC8325 chromosome showing SaPI pseudo-pac (ppac) sites.

Chromosomal replication origin is at 0 kbp (RO). The 3 prophage genomes are omitted and several of the well-characterized SaPIs are indicated. Numbers represent ppac sites, with those on the outside oriented clockwise, on the inside, counterclockwise. Tabulation in the center lists the types of genes within 16 kb of each ppac site, on either side. Note that those downstream of any ppac site will be transduced by the SaPI at much higher frequency than those upstream (reprinted from [40] with the kind permission of Elsevier).
