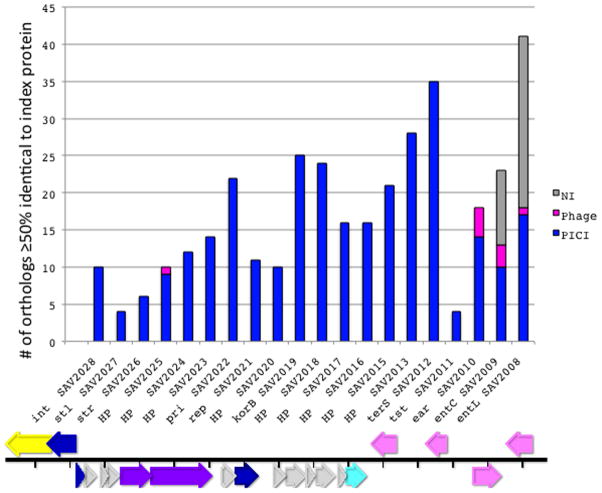
Fig. 5. Ortholog analysis of SaPI ORFs.
An ortholog list [43] was prepared for each of the 22 ORFs of SaPI-Mu50(V) listed along the abscissa. Each vertical bar represents all orthologs with ≥50% nucleotide sequence identity to the index ORF. The type of insert corresponding to each ortholog was determined by inspecting the KEGG genome pattern in the regions flanking the ORF. The data on which this chart is based are listed in online supplementary material, Table S1. Typical KEGG genome patterns for SaPIs and prophages are shown in online supplementary material Figs. 5A and B, respectively. Gray – NI - no insert; pink – prophage; blue – SaPI. Below the graph is a diagram of the genome of SaPI-Mu50(V) showing the genes corresponding to those in the graph.

