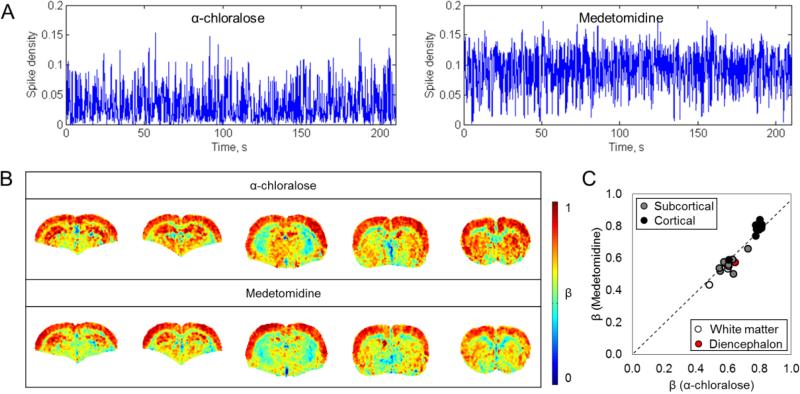
Figure 4.
Comparison between β measured at different brain activity levels (α-chloralose vs. medetomidine). (A) A comparison of the corresponding spike density functions showed a roughly two times higher activity level with medetomidine. See also Table 3. (B) Mean β images for representative slices in rats anesthetized with α-chloralose and medetomidine. (C) Relationship between regional β with α-chloralose (βα) and medetomidine (βmed) showed strong correlation (r2 = 0.91), indicating a very similar pattern for β in all ROIs across brain states. Regions of both maximum and minimum for β were nearly identical among α-chloralose and medetomidine. Among all ROIs, maximum β was among the primary somatosensory regions, while minimum β was found in ic (Βα = 0.48±0.08. βmed = 0.43±0.01). In subcortical gray matter, maximum β was observed in Hif (Βα = 0.73±0.10. βmed = 0.66±0.04). ANOVA test suggested that βmed were not significantly different from βα (p > 0.05). Likewise, student's t-test did not give significant difference in any ROI between α-chloralose and medetomidine.

