
Fig. 11.
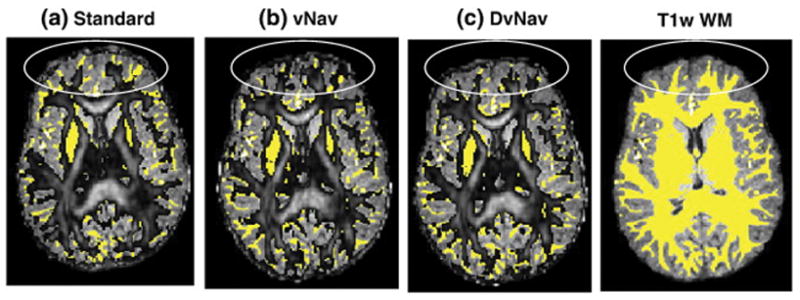
FA maps (0.2<FA<1) from (a) standard, (b) vNav (motion correction only), and (c) DvNav acquisitions overlaid on T1w WM masks (yellow). The ovals show regions of high distortion. (readout = left to right; phase encode = anterior to posterior).