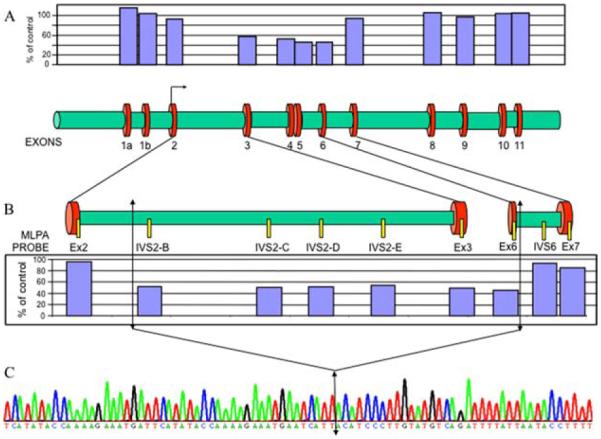
Figure 2.

Breakpoints localization of the deletion of exons 3–6. (A, lower part) Structure of the PRKAR1A gene at scale with the 12 exons and the introns. (A, upper part) MLPA histogram for patient II-2 showing a heterozygous deletion of exons 3–6. The breakpoints are therefore located in introns 2 and 6. (B, upper part) Schematic representation of introns 2 and 6 with the positions of the different MLPA probes designed to locate the breakpoints. (B, lower part) Histograms of this specific MLPA analysis identify the breakpoints at the proximal sequences of introns 2 and 6. Arrows locate these potential breakpoints. (C) Sequence analysis around the breakpoints, identifying precisely the size of the deletion. The double arrow indicates the fusion point between introns 2 and 6.
