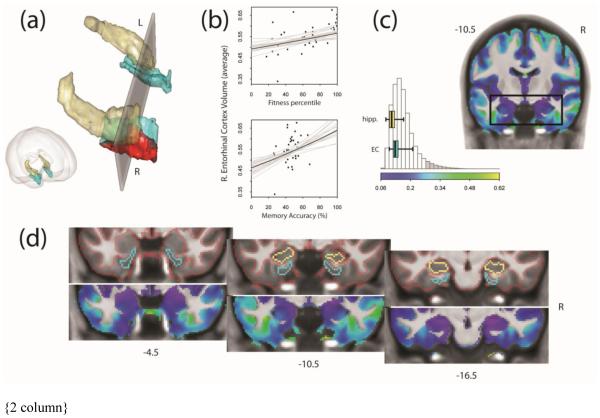
Fig. 2.
Results of ROI-based VBM analysis. (a) shows the region of right entorhinal cortex (EC) where we find gray matter volume is associated with aerobic fitness percentile. Results (red) are shown within a 3D rendering of our anatomical regions of interest, the hippocampus (gold) and EC (cyan). The gray plane coincides with the black box drawn on the MR slice in (c) and corresponds to slice y = 10.5 cm caudal to the anterior commissure. The relationships between volume in the right EC (averaged over the whole structure) and fitness percentile and recognition memory accuracy is portrayed in (b). Gray lines illustrate the uncertainty in the regression fits. (c) shows the spatial layout and distribution of the coefficient of variation (CV) for gray matter volume across participants. Values for hippocampal and EC voxels are shown as horizontal boxplots overlaid on the histogram, indicating that variation is not unusually large for these regions. Boxplots show absolute range, interquartile range, and median. The histogram depicts the 95% high-density region (white bars) and the extreme tails (gray bars). Exploration of gray matter variability is extended throughout our ROI in (d). Sections run caudally from the anterior EC through posterior EC and hippocampal head. The top images show the borders of the EC, hippocampus, and labeled gray matter; bottom images show corresponding CV maps. All results are depicted on the group average brain. Figures were made using functionality from the R rgl and misc3d packages (Adler et al., 2014; Feng and Tierney, 2008).

