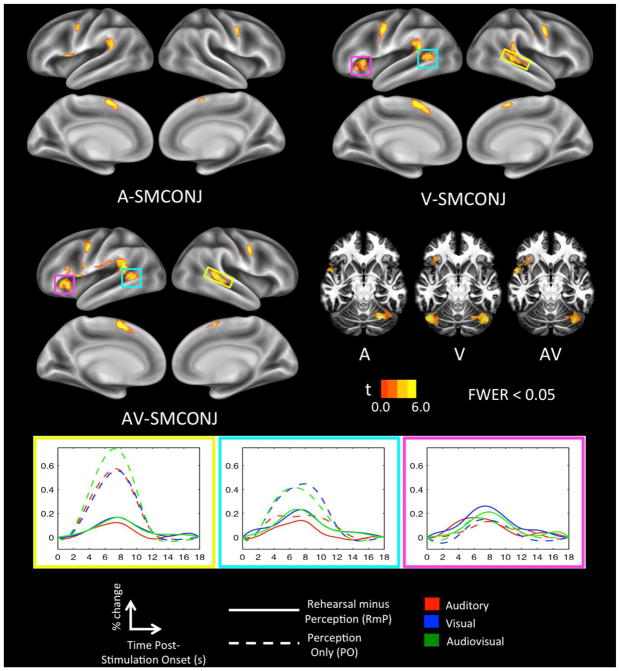
Figure 2. Sensorimotor conjunction maps.
Sensorimotor brain regions were highlighted in each modality by taking the conjunction of ‘perception only’ (CP > baseline) and ‘rehearsal minus perception’ (P+RHRS > P+REST) contrasts. These regions are displayed on separate cortical surface renderings for each input modality (A, V, AV). Also plotted are show-through volume renderings for each modality with axial slices peeled away to allow visualization of cerebellar activation. Activation time-courses (mean percent signal change) are shown for sensorimotor regions that were unique to the V and AV modalities; time zero indicates the onset of a 6s stimulation block. Yellow: Right pSTS. Teal: Left pSTS/MTG. Magenta: Left insula.

