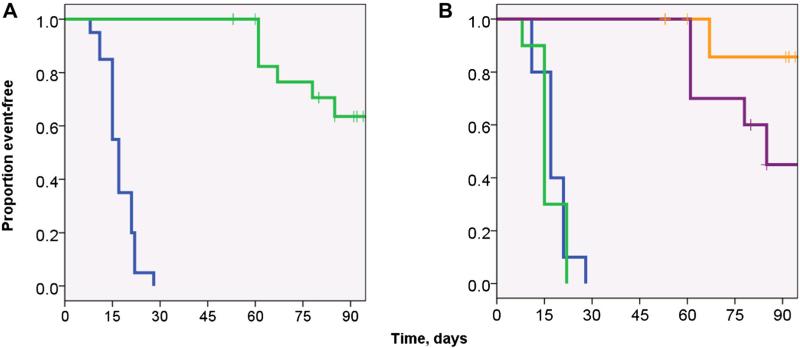
Fig. 2.
Kaplan–Meier event-free survival (EFS) curves of the standard radiotherapy dosing treatment groups. A: EFS curves of non-irradiated mice (blue line) versus irradiated (green line) with implanted xenografts (median EFS was 15 days versus 75 days for untreated versus treated mice, respectively [P < 0.001]). B: Event-free survival radiated versus non-irradiated mice, stratified by xenograft line. There was no significant difference between the untreated groups (Rh18 and Rh30 controls, blue and green lines, respectively). There was a trend in improved EFS in the treated Rh18 group (orange line) versus the treated Rh30 group (purple line, P = 0.072; log-rank). The median survival of Rh18 group could not be calculated due to the lack of events within the 12-week observational period. Note: After implantation, xenografts were allowed to grow until reaching approximately 0.5–1.0 cm3 in volume and were then randomized to treatment or control (no treatment) groups; with the first measurement representing Day 0 of experiments.

