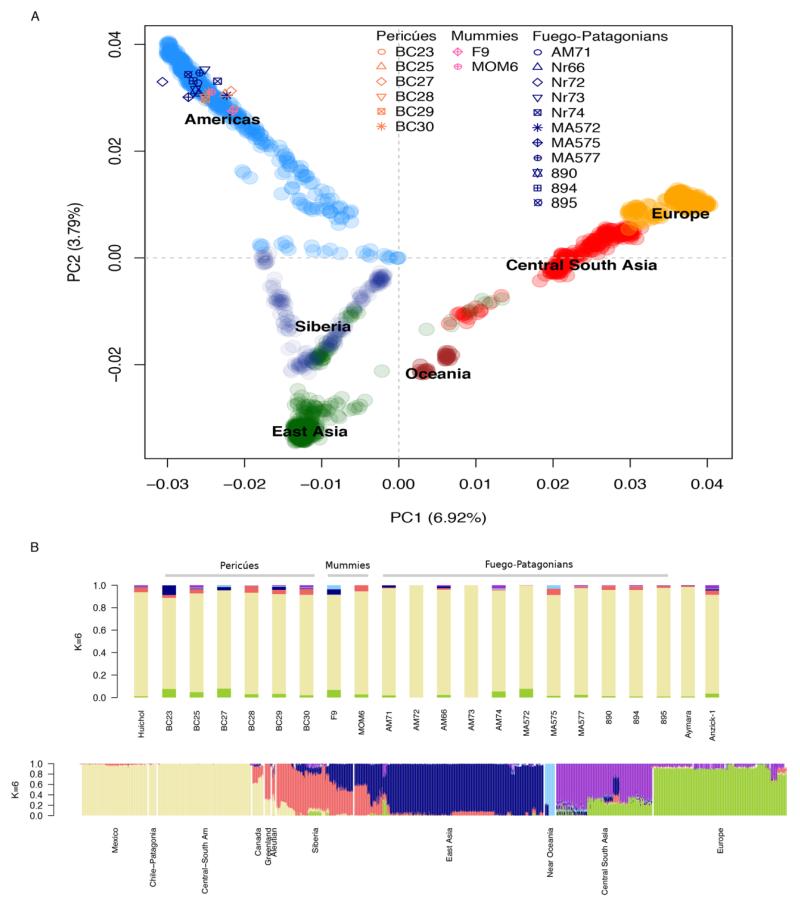
Fig. 5. The Paleoamerican model.
(A) Principal Component Analysis plot of 19 ancient samples combined with a worldwide reference panel, including 1,823 individuals from (6). Our samples plot exclusively with American samples. For plots with other reference panels consisting of Native American populations, see fig. S32. (B) Population structure in the ancient Pericú, Mexican mummy and Fuego-Patagonian individuals from this study. Ancestry proportions are shown when assuming six ancestral populations (K = 6). The top bar shows the ancestry proportions of the 19 ancient individuals, Anzick-1 (5), and two present-day Native American genomes from this study (Huichol and Aymara). The plot at the bottom illustrates the ancestry proportions for 1,823 individuals from (6). Our samples show primarily Native American (ivory, >92%) and Siberian (red, ca. 5%) ancestry. For the plot with K =13, see fig. S33.

