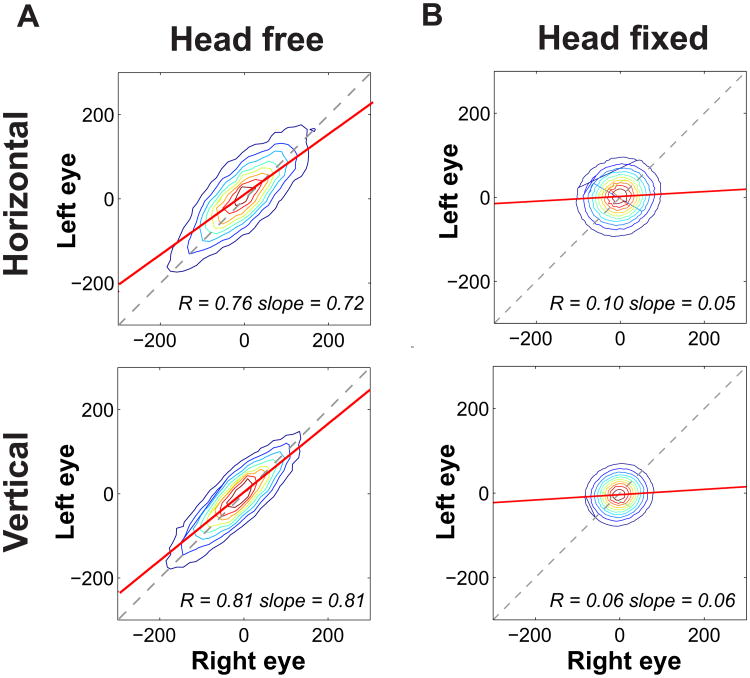
Figure 2. Binocular drift coordination.
Joint probability distributions for the instantaneous velocities of ocular drift in the two eyes. Colored lines represent iso-probability contours. The two columns refer to different conditions: (A) Natural head-free binocular viewing. (B) Head-fixed binocular viewing. In this latter condition, the subject's head was firmly immobilized by a bite-bar and a head-rest. The two rows show horizontal and vertical velocity components. In all panels, the solid and dashed lines represent the linear regression and the 45° diagonal, respectively. Average correlation and slope of the linear regression are reported in each panel. Data represent averages across N=4 observers. See Figure S2 for the results of similar analysis under monocular viewing.

