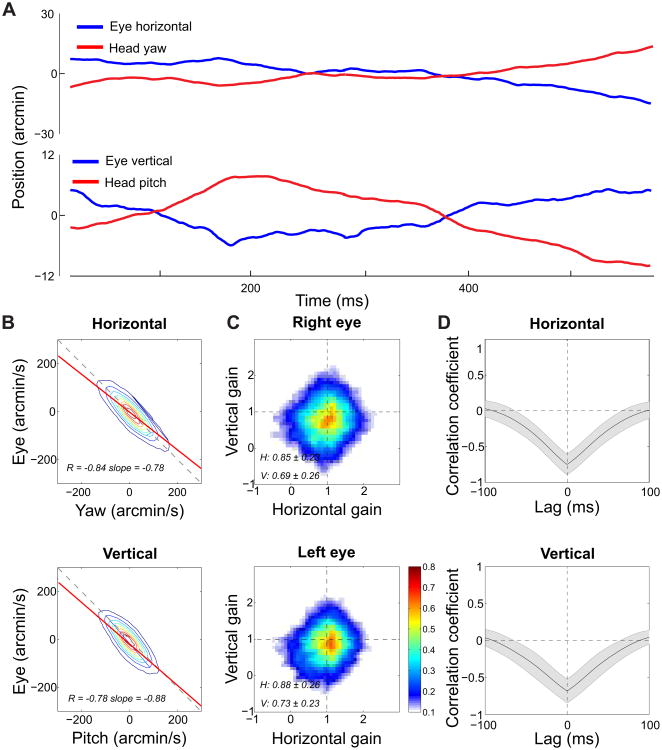
Figure 3. Fixational head-eye coordination.
(A) An example of head and eye traces during steady fixation. Note the very small scale of the movements on the y axis. (B) Comparison between the velocities of head and eye rotations. The horizontal and vertical components of ocular drift velocity are plotted as a function of the angular speeds of head yaw and pitch, respectively. Solid and dashed lines represent the linear regressions and the 45° diagonal. (C) Head/eye compensation gain. Distributions of the instantaneous gain between fixational head and eye movements. On each axis, gain equal one corresponds to perfect compensation (the fixated target remains immobile on the retina). Larger and smaller gain values represent over- and under-compensation, respectively. (D) Head/eye compensation delay. Mean cross-correlation functions between head and eye rotations. Shaded areas represent one standard deviation. Data are averages across all the recorded eyes during normal binocular viewing. See Figure S2 for the results of similar analysis under monocular viewing.

