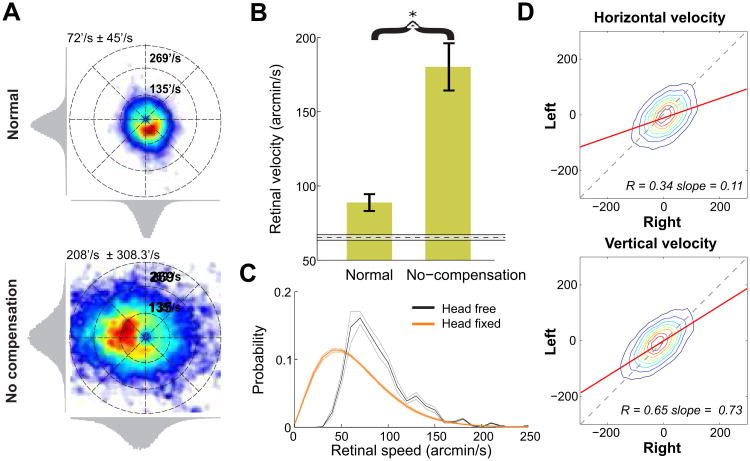
Figure 4. Retinal image motion.
(A) Examples of probability distributions of the velocity of the fixated target on the retina. (Top) Normal head-free fixation. (Bottom) No head-eye coordination. Compensation was disrupted by decoupling head and eye traces. (B) Average speeds of the retinal projection of the fixated target for the two conditions in A. For comparison, the dashed line shows the average retinal speed measured in standard experiments with head immobilization, when subjects freely observed natural scenes. Error bars and the shaded region represent one standard deviation. The asterisk marks statistical significance at p < 0.005 (two-tailed paired t-test). (C) Retinal speed distributions in the sequential looking task under head-free and head-fixed conditions. Error bars represent s.e.m. (D) Binocular correlation in retinal image motion. Joint probability distributions of the velocity components in the projections of the fixated target in the two retinas. Different rows compare horizontal and vertical velocities (arcmin/s). In B-D, data represent averages across all recorded eyes.

