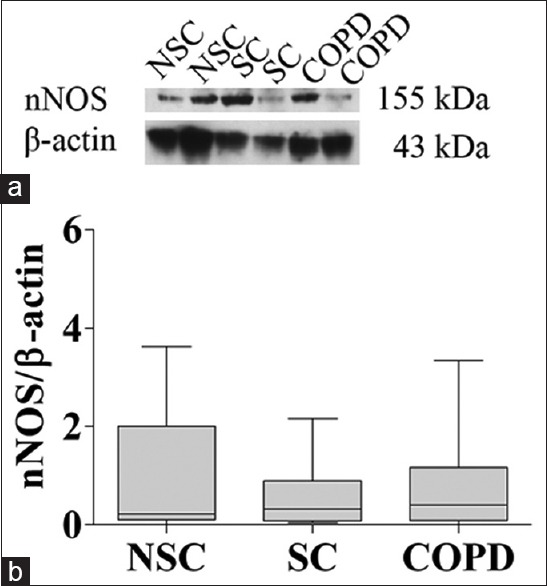
Figure 2.

nNOS protein expression in peripheral lung tissue from NSC subjects, SC subjects, and COPD patients. (a) Representative Western blot analysis of nNOS and β-actin; (b) Densitometric analysis of nNOS and β-actin bands. Each bar represents the median ± interquartile of each group. nNOS: Neuronal nitric oxide synthase; NSC: Nonsmokers control; SC: Smokers control; COPD: Chronic obstructive pulmonary disease.
