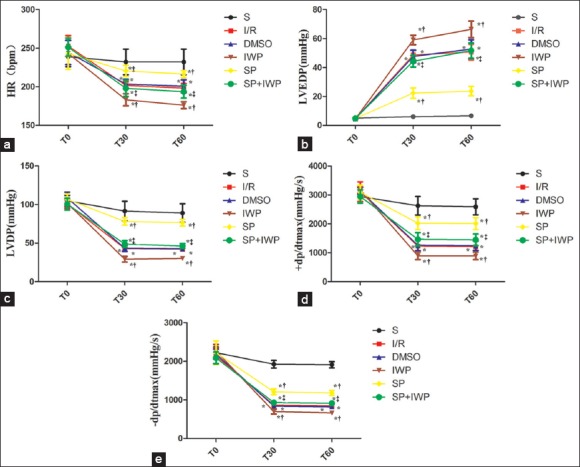
Figure 1.

(a) Data are reported as means ± standard deviation (n = 12 for each group). *P < 0.05 versus S; †P < 0.05 versus I/R; ‡P < 0.05 versus sevoflurane preconditioning (two-way ANOVA). S: Sham group; I/R: Ischemia/reperfusion; DMSO: Dimethyl sulfoxide; IWP: Ischemia/reperfusion + inhibitor IWP-2; SP: Sevoflurane preconditioning; SP + IWP: Sevoflurane preconditioning + inhibitor IWP-2. T0: The end of equilibration; T30: 30 min after reperfusion; T60: 60 min after reperfusion; HR: Heart rate; (b) Data are reported as means ± standard deviation (n = 12 for each group). *P < 0.05 versus S; †P < 0.05 versus I/R; ‡P < 0.05 versus sevoflurane preconditioning (two-way ANOVA). T0: The end of equilibration; T30: 30 min after reperfusion; T60: 60 min after reperfusion; LVEDP: Left ventricular end-diastolic pressure; I/R: Ischemia-reperfusion; (c) Data are reported as means ± standard deviation (n = 12 for each group). *P < 0.05 versus S; †P < 0.05 versus I/R; ‡P < 0.05 versus sevoflurane preconditioning (two-way ANOVA). T0: The end of equilibration; T30: 30 min after reperfusion; T60: 60 min after reperfusion; LVDP: Left ventricular developed pressure; I/R: Ischemia-reperfusion; (d) Data are reported as means ± standard deviation (n = 12 for each group). *P < 0.05 versus S; †P < 0.05 versus I/R; ‡P < 0.05 versus sevoflurane preconditioning (two-way ANOVA). T0: The end of equilibration, T30: 30 min after reperfusion, T60: 60 min after reperfusion; +dp/dt = Max rate of left ventricular development pressure; I/R: Ischemia-reperfusion; (e) Data are reported as means ± standard deviation (n = 12 for each group). *P < 0.05 versus S; †P < 0.05 versus I/R; ‡P < 0.05 versus sevoflurane preconditioning (two-way ANOVA). T0: The end of equilibration, T30: 30 min after reperfusion, T60: 60 min after reperfusion; −dp/dt: Max rate of left ventricular fall pressure; I/R: Ischemia-reperfusion.
