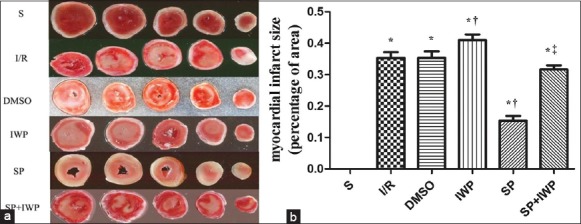
Figure 5.

Effects of myocardial infarct size of isolated hearts in 6 groups. (a) Representative cross-sections of rat hearts from 6 groups after ischemia-reperfusion and staining with TTC to visualize the infarcted area; Effects of myocardial infarct size of isolated hearts in 6 groups; (b) Infarct size expressed as percentage of left ventricular area for each group. Values are means ± standard deviation (n = 6 for each group), *P < 0.05 versus S; †P < 0.05 versus ischemia-reperfusion; ‡P < 0.05 versus sevoflurane preconditioning (one-way ANOVA).
