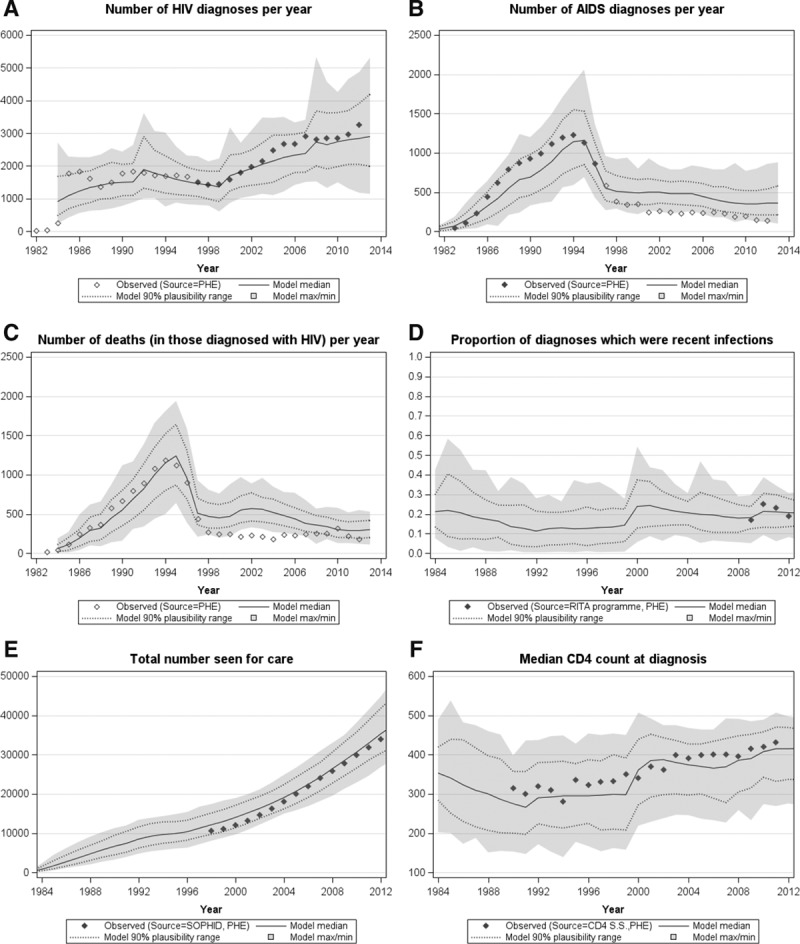
FIGURE 1.

Calibrating the model to data on MSM in the UK. A, Number of HIV diagnoses, (B) number of AIDS diagnoses, (C) number of deaths, (D) proportion of diagnoses which were recent infections (defined here as an infection which took place within six months of an HIV diagnosis), (E) total number seen for care, (F) Median CD4 count at diagnosis. Diamonds represent surveillance data until 2012 supplied by Public Health England (PHE). Filled diamonds show data used to calibrate the model; open diamonds show data not used to calibrate the model. Model median (solid line), model 90% plausibility range (dotted lines) and model range (light grey band) also shown. RITA indicates recent infection testing algorithm; SOPHID, survey of prevalent HIV infections diagnosed; CD4 SS, CD4 surveillance scheme.
