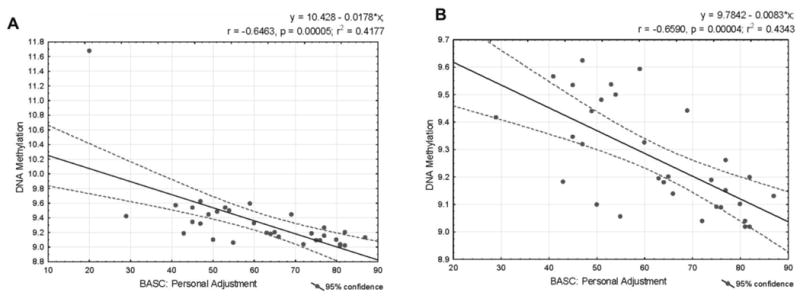
Figure 2.

Linear regression model that describes the relationship between the Personal Adjustment composite score and the average methylation level of 38 methylation markers that were associated with both Personal Adjustment and the PARQ-slope. Relationships were established for the entire studied sample (A) and for the sample without any cases with extremely high methylation levels (B). Both plots show high negative associations between the variables.
