
Figure 3.
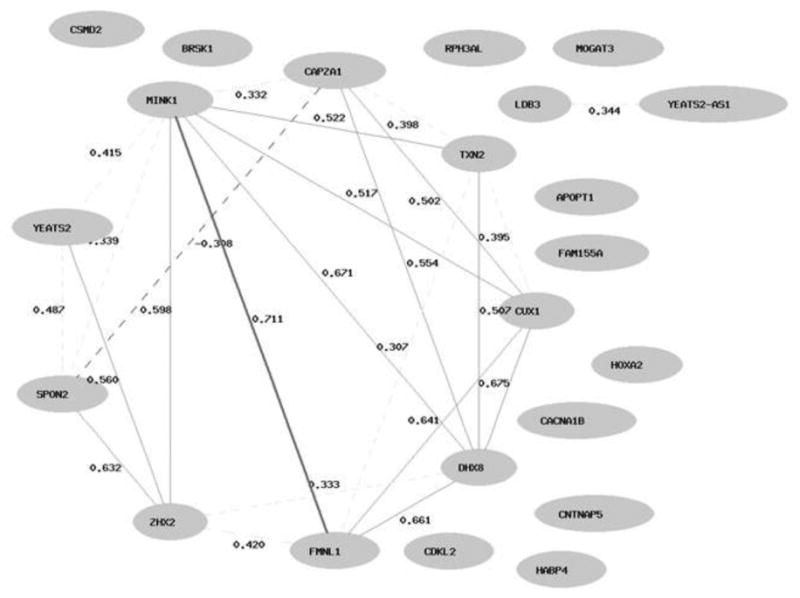
The tissue (blood) specific co-expression network for the 23 genes associated with both the PARQ-slope and the BASC-CV Personal Adjustment, constructed based on Genotype-Tissue Expression (GTEx) project database (GTExConsortium, 2013) via a WebQTL resource (http://www.genenetwork.org). Interactions for absolute correlations above .50 are shown; Pearson pairwise correlations are represented. The nodes contain the symbols of genes. Notably, 12 of these 23 genes are known to be expressed in blood cells, and 9 of 12 active genes showed a high co-variability in their expression levels among individuals.