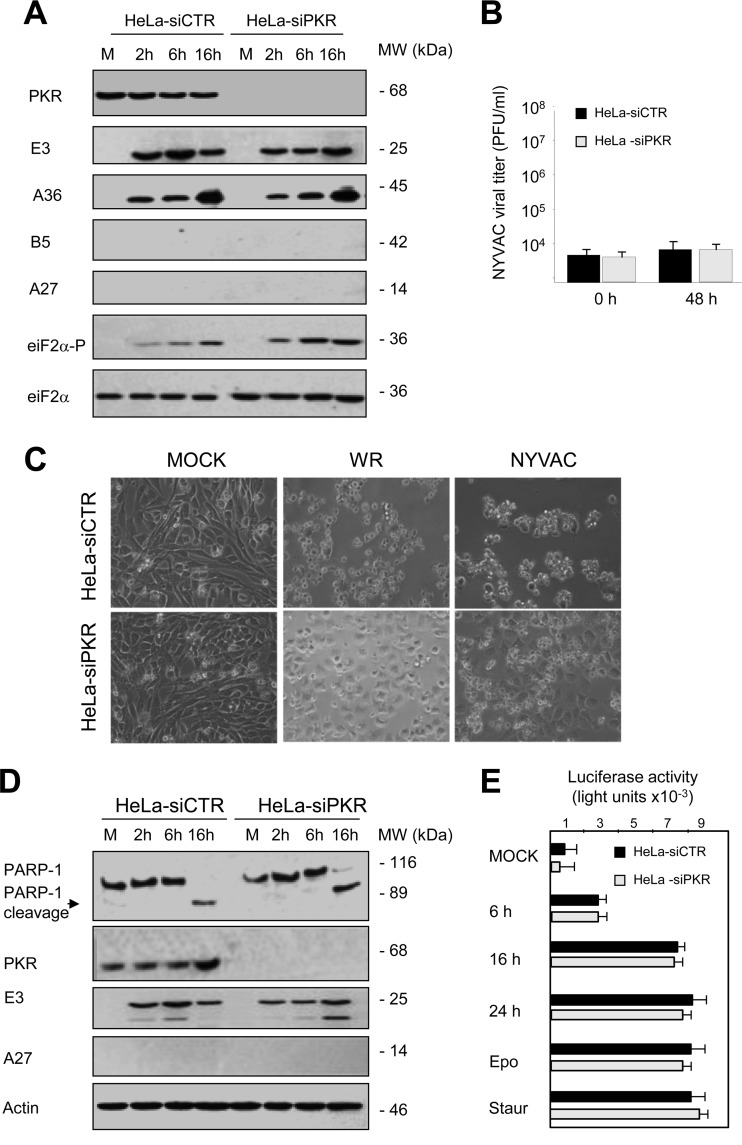
FIG 3.
Protein synthesis, apoptosis induction, and eIF2α phosphorylation in HeLa-siCTR and HeLa–siPKR cells infected with NYVAC. (A) Viral protein expression during NYVAC infection. HeLa-siCTR or HeLa-siPKR cells were mock infected (M) or infected with NYVAC (5 PFU/cell). At the indicated times postinfection, equal amounts of proteins from cell extracts were fractionated by SDS-PAGE, transferred to nitrocellulose, and treated with specific antibodies to virus early proteins (E3 and A36) and late proteins (B5 and A27). The levels of PKR, eIF2α, and phosphorylated eIF2α were visualized by using specific antibodies, and actin was used as a loading control. Molecular masses (“MW”; in kilodaltons) are indicated and were determined based on protein standards. (B) Cells were infected (0.01 PFU/cell) and at the different times indicated, cells were harvested and virus yields were determined by plaque assay. Results represent the means ± the standard deviations of three independent experiments. P values from a two-tailed t test, assuming nonequal variance, were determined. In all cases, we obtained P values of <0.01. (C) Apoptosis induction during NYVAC infection in HeLa cells is a PKR-independent process. HeLa-siCTR or HeLa-siPKR cells were mock infected (M) or infected with WR or NYVAC (5 PFU/cell). At the indicated times postinfection, apoptosis was assessed via phase-contrast microscopy. NYVAC-infected cells showed characteristic apoptosis, defined by a rounded, floating, phase-bright, wrinkled shape. (D) Time course of PARP-1 cleavage during NYVAC infection. HeLa-siCTR or HeLa-siPKR cells were mock infected (M) or infected with NYVAC (5 PFU/cell). At the indicated times postinfection, cells were harvested and equal amounts of proteins from cell extracts were fractionated by SDS-PAGE, transferred to nitrocellulose, and immunoblotted with antibodies against PARP-1 and against virus early (E3) and late (A27) proteins. An 89-kDa PARP-1 cleavage product was observed at 16 hpi in both cell lines. Molecular masses (“MW”; in kilodaltons) are indicated and are based on protein standards. PKR levels were visualized using a specific anti-PKR antibody, and actin was used as a loading control. (E) Quantification of apoptotic cells after NYVAC infection. HeLa-siCTR or HeLa-siPKR cells were mock infected (M) or infected with NYVAC (5 PFU/cell), and at 6, 16, and 24 hpi, cells were fixed and processed to quantify apoptosis by using a caspase-Glo 3/7 assay kit. Etoposide and staurosporine treatments were used as apoptosis activators. Results represent the means ± the standard deviations from three independent experiments. P values from a two-tailed t test assuming nonequal variance were determined. In all cases, we obtained P values of <0.05.

