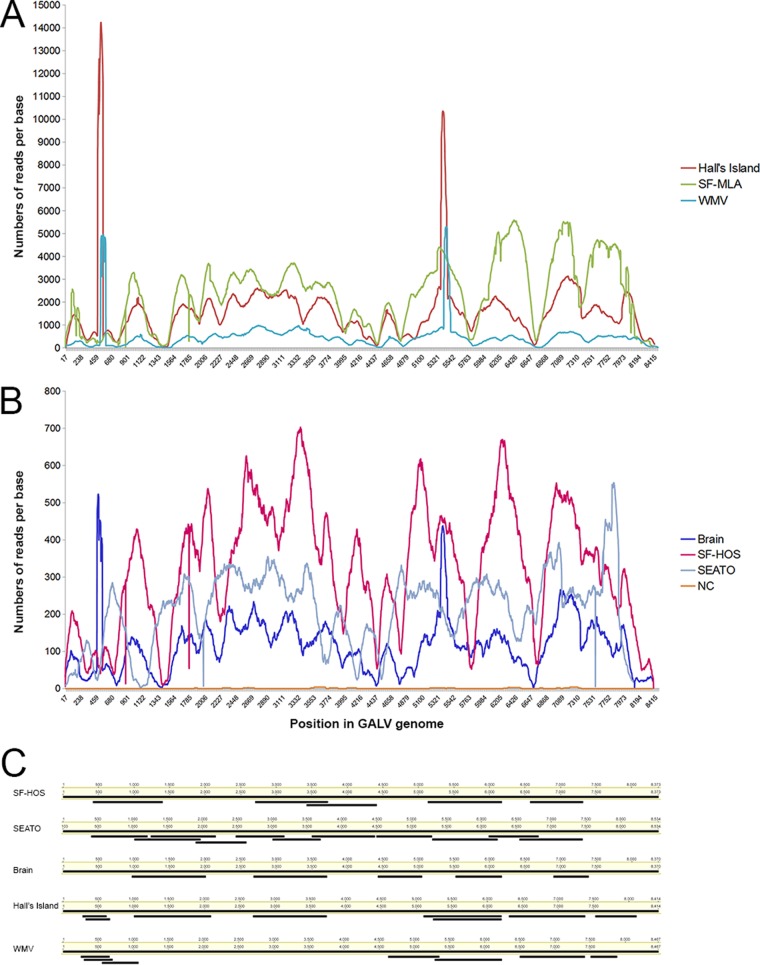
FIG 1.
Hybridization capture sequence and Sanger sequence coverage across the proviral genome for the GALV strains. The sequence coverage is shown for each nucleotide position, numbered as in the corresponding strain consensus sequence. Mapping results for a negative control (NC) are also shown. Each sample is color coded. Panel A shows a coverage profile of the strains that reached very high values (up to 14,000 reads per base), while panel B shows the coverage profile of the strains with lower coverage (up to 700 reads per base). Panel C shows the position of each Sanger sequence generated by PCR in comparison to the full genome consensus sequences of the GALV strain from which it was generated. The Sanger sequences presented here were all of high quality and were used to confirm the bioinformatics assembly of sequences obtained by hybridization capture.

