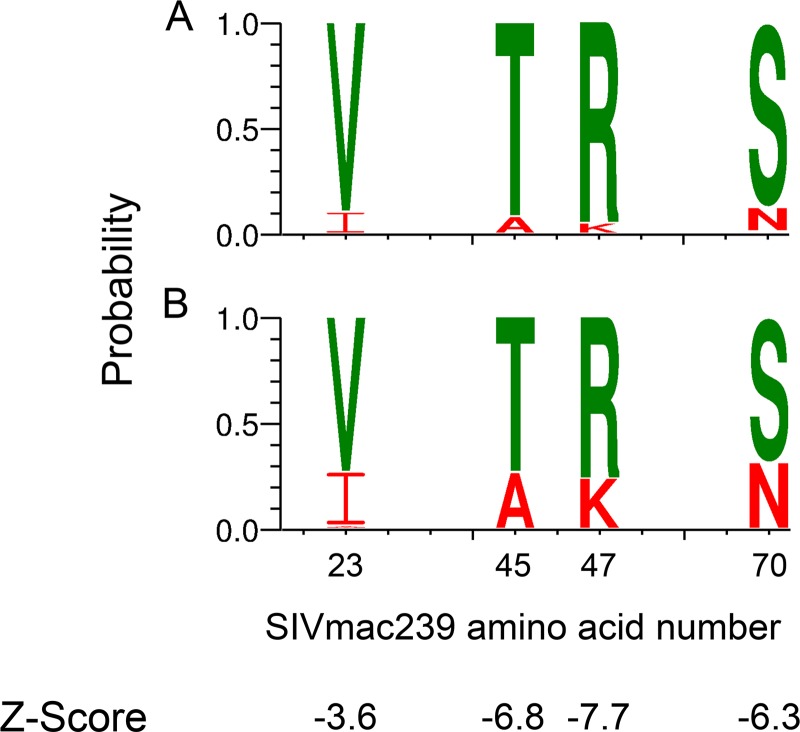
FIG 3.
Weblogo and Sequence Harmony comparison of challenge stocks to T/F Env sequences. Sequence Harmony analysis comparing challenge stock to T/F Envs identified four amino acid positions with Z-scores below −3: positions 23, 45, 47, and 70 in gp120. Differences in amino acid composition at each of these locations are illustrated by Weblogos for the challenge stock (A) and all T/F Env sequences combined (B). The height of the amino acid within the stack at each position indicates its relative frequency. For illustrative purposes, I-A-K-N residues are highlighted in red and V-T-R-S residues in green. P values for Fischer's exact tests at each position were ≤0.01 (see Table S1 in the supplemental material).

