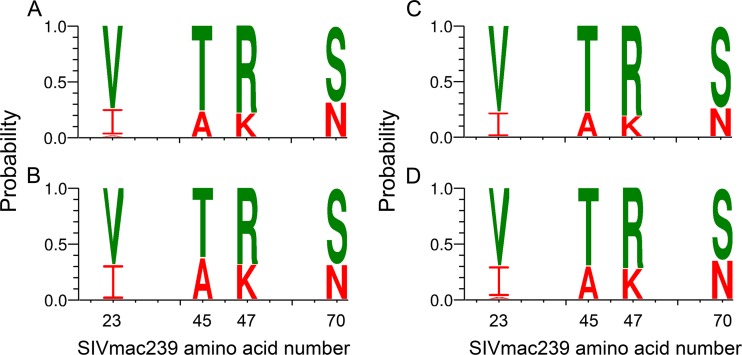
FIG 4.
Weblogo comparison of vaccinated versus control T/F Envs and intrarectal versus intravaginal T/F Envs. Weblogos were generated to illustrate similarity in amino acid composition at positions 23, 45, 47, and 70 between T/F Envs from vaccinated (A) and control (B) animals or intrarectally challenged (C) and intravaginally challenged (D) animals. P values for Fischer's exact tests comparing results shown in panels A versus B and panels C versus D at each position were not significant (see Table S1 in the supplemental material). The height of the amino acid within the stack at each position indicates its relative frequency. For illustrative purposes, I-A-K-N residues are highlighted in red and V-T-R-S residues in green.

