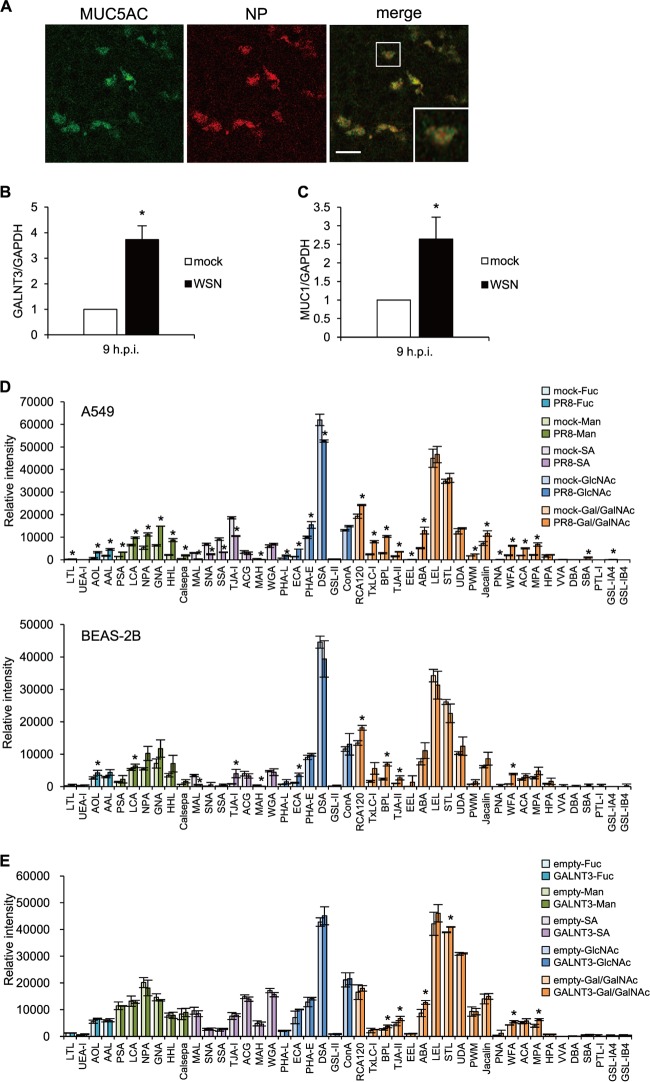
FIG 3.
GALNT3 affects mucin production and O-linked glycosylation in IAV-infected cells. (A) IAV infects goblet cells expressing MUC5AC. Differentiated HBECs were infected with WSN virus at an MOI of 3.0. Nine hours after inoculation, virus-infected cells were detected by immunofluorescence analysis using anti-MUC5AC and anti-NP antibodies. Scale bar, 30 μm. A high-magnification image of an infected cell (square) is also shown. (B and C) The relative expression levels of GALNT3 (B) and MUC1 (C) mRNAs in HBECs were detected at 9 h postinfection. Statistical significance was analyzed by Student's t test. *, P < 0.05. (D and E) Lectin microarray analysis of PR8 virus-infected A549 (upper) and BEAS-2B (lower) cells (D) and recombinant GALNT3-expressing BEAS-2B cells (E). The cells were infected with PR8 virus at an MOI of 3.0, and samples were isolated at 12 h postinfection. Each graph was generated according to lectin group. The lectin groups are colored according to their recognition of the sugar chains indicated to the right of the graphs. Fuc, l-fucose; Man, d-mannose; SA, sialic acid; GlcNAc, N-acetyl-d-glucosamine; Gal/GalNAc, d-galactose/N-acetyl-d-galactosamine. The membrane fractions extracted from infected and uninfected cells were labeled and incubated with a LecChip representing 45 lectins. The net intensity value for each spot of the microarray was calculated by subtracting a background value from the signal intensity. The net signal intensity values of three spots were averaged. All values are expressed as the means (n > 3) ± SEM. *, P < 0.05.

