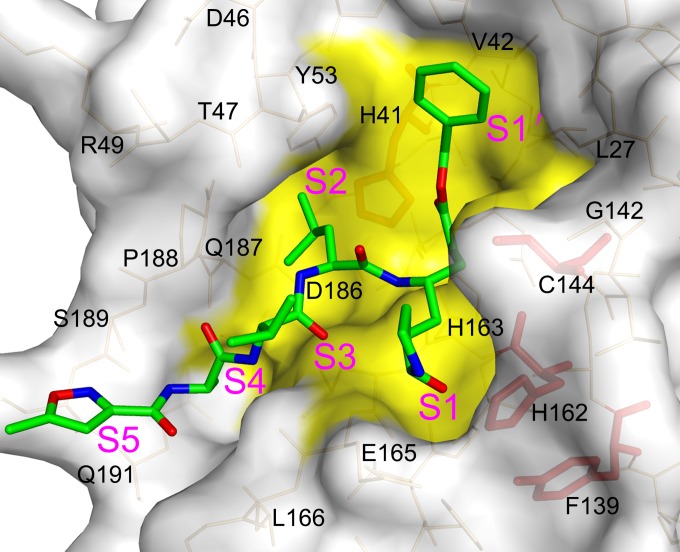
FIG 4.
Structural insight into the mutagenesis analysis of the FIPV Mpro active center. Surface representation of FIPV Mpro complexed with inhibitor N3. The substrate-binding pocket is colored in yellow. The N3 molecule is shown as green sticks. Residues His41, Cys144, Tyr160, and His162 are shown as red sticks.

