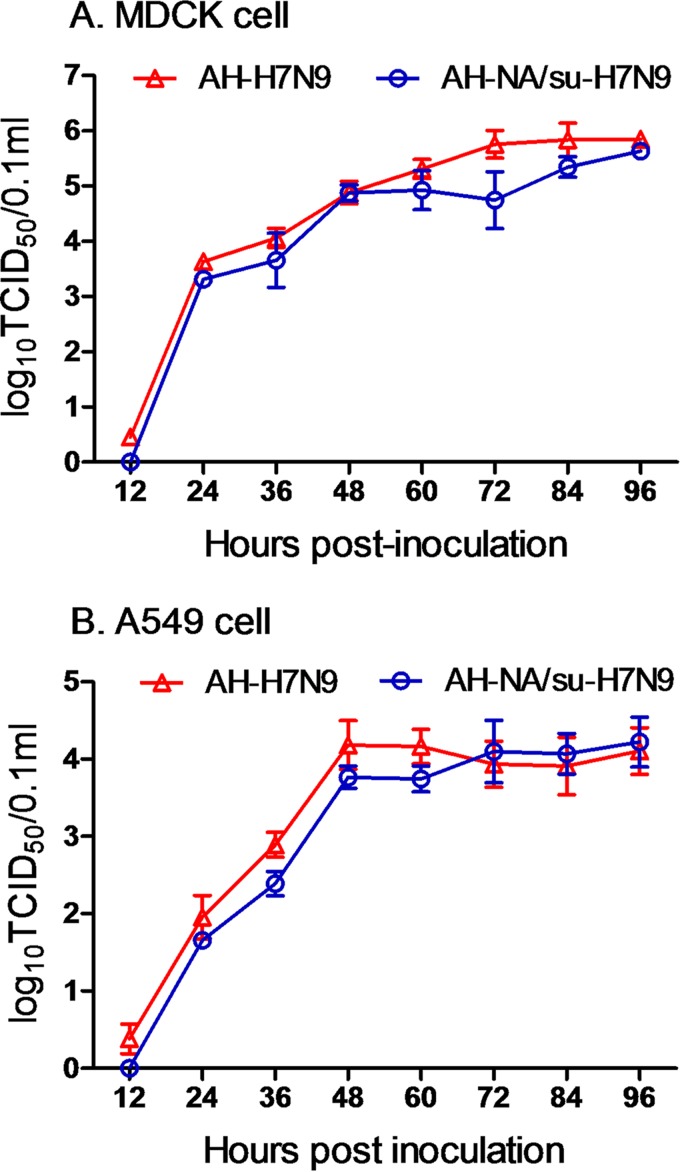
FIG 2.
Multiple-cycle growth curves of the H7N9 viruses with a long or short NA stalk. The growth kinetics of the AH-H7N9 and AH-NA/su-H7N9 viruses were measured by multiple-cycle growth curve analysis in MDCK (A) and A549 (B) cells. The cells were inoculated at a multiplicity of infection (MOI) of 0.001. Supernatants were collected every 12 h until 96 hpi, and the virus titers were determined by measuring 50% tissue culture infective doses (TCID50) in MDCK cells. The data are presented as the means ± standard deviations of results from three independent experiments and were compared to each other by two-way ANOVA.

