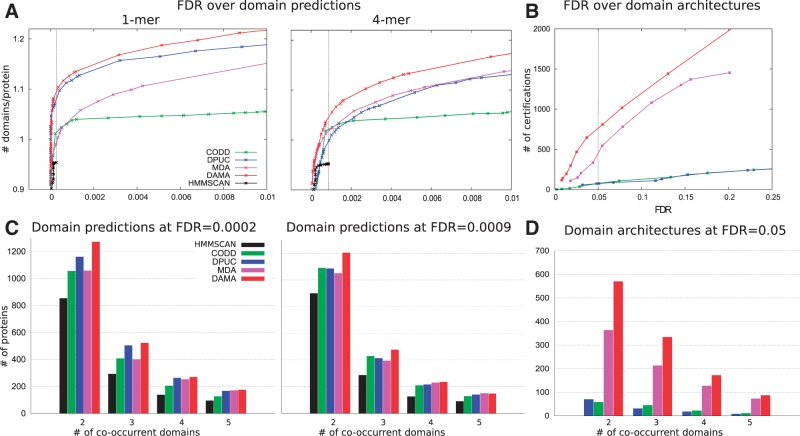
Fig. 3.
Performance of DAMA and other tools on the P. falciparum proteins annotation. (A) The y-axis is the number of predicted domains per protein (‘signal’), while the x-axis is the FDR (‘noise’), so better performing methods have higher curves (more signal for a given noise threshold). On the 1-mer and the 4-mer hypotheses, DAMA (red) outperforms all hmmscan variations tested (black) and the methods MDA (pink), dPUC (blue) and CODD (green). (B) The y-axis is the number of certified domains (‘signal’) obtained by a method, while the x-axis is the FDR (‘noise’) computed over domain architectures. Colors as in (A). (C) Distribution of the number of proteins with a fixed number of predicted domains, for each tool at FDR -4 (see vertical bar in A) for 1-mer and at FDR -4 for 4-mer. (D) Distribution of number of proteins with a fixed number of predicted domains, for each tool at FDR (see vertical bar in B)

