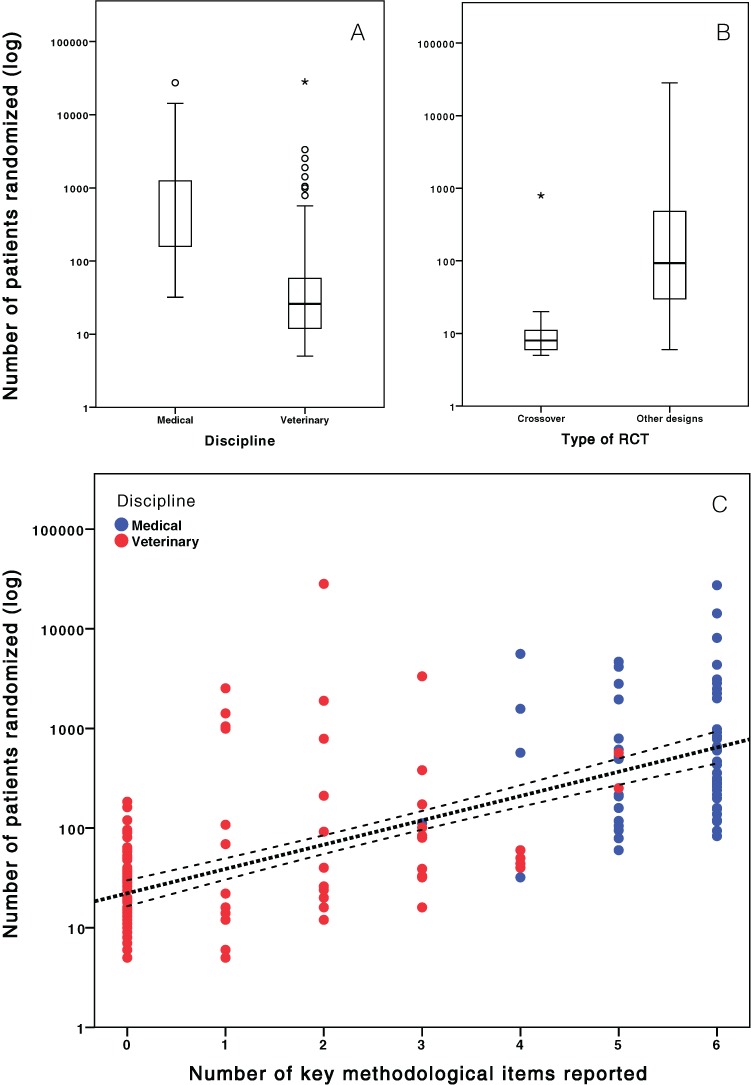
Figure 3. Number of patients randomized in RCTs and methodological quality.

(A) Difference in number of patients randomized in veterinary and general medicine. (B) Difference in number of patients randomized in cross-over and other study designs. (C) Correlation between the number of methodological issues (primary outcome, power calculation, random sequence generation, allocation concealment, estimation methods, intention-to-treat) reported and number of patients enrolled in each RCT. Notice that the y-axis was plotted on a logarithmic function.
