
Figure 2.
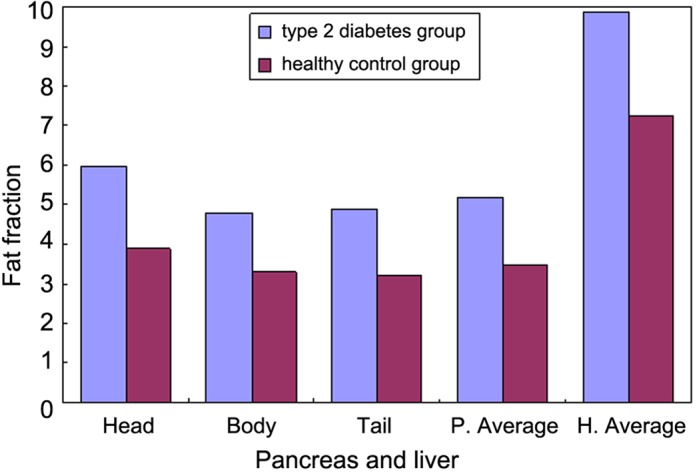
Average fat fraction in the pancreatic head, body and tail regions, and in the liver, of the type 2 diabetes and healthy control groups. P, pancreas; H, hepatic.
Official websites use .gov
A
.gov website belongs to an official
government organization in the United States.
Secure .gov websites use HTTPS
A lock (
) or https:// means you've safely
connected to the .gov website. Share sensitive
information only on official, secure websites.
Average fat fraction in the pancreatic head, body and tail regions, and in the liver, of the type 2 diabetes and healthy control groups. P, pancreas; H, hepatic.