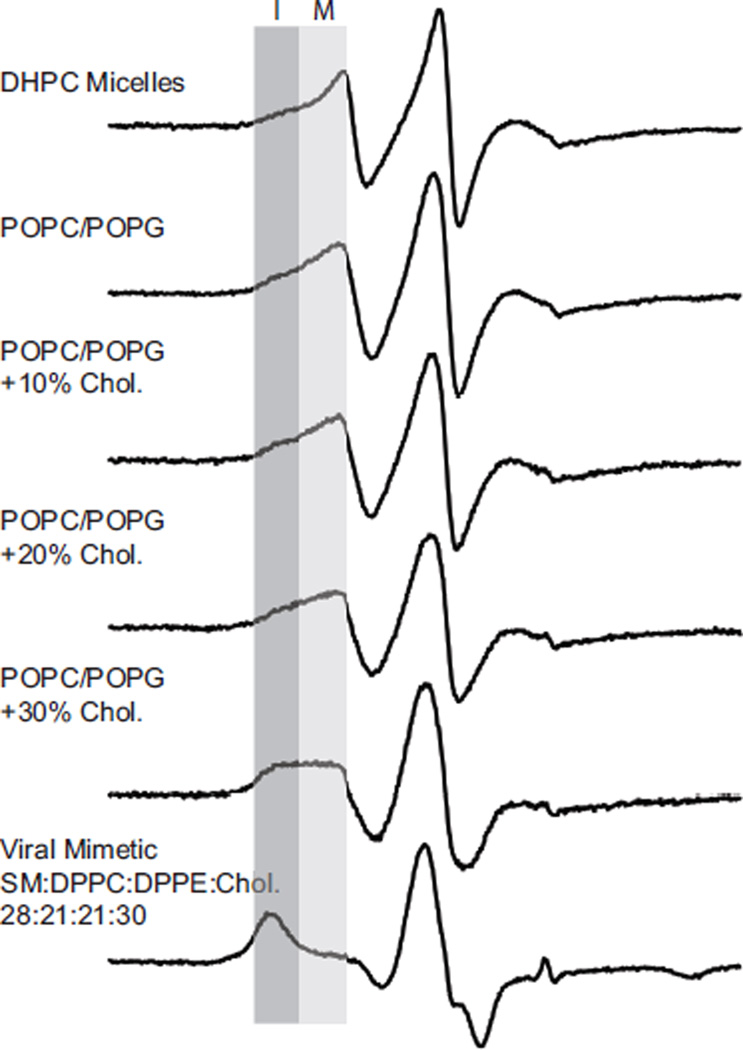
Figure 2. EPR line shape depends on choice of membrane mimic.
Normalized X-band CW EPR spectra of M2TMC (23–60) spin labeled at I42C in DHPC micelles, POPC/POPG (4:1) bilayers with varying molar quantities of cholesterol, and a viral membrane mimic (SM:DPPC:DPPE:Chol:PEG-PE 23:21:21:30:1). Each sample was spin-diluted with unlabeled peptide (unlabeled:labeled 4:1) to eliminate broadening resulting from spin-coupling between monomers within the homotetrameric protein. The darker gray box indicates a broader, more immobilized component (I) that increases in intensity from top to bottom. The more mobile component (M) indicated by a lighter gray box decreases in intensity from top to bottom.

