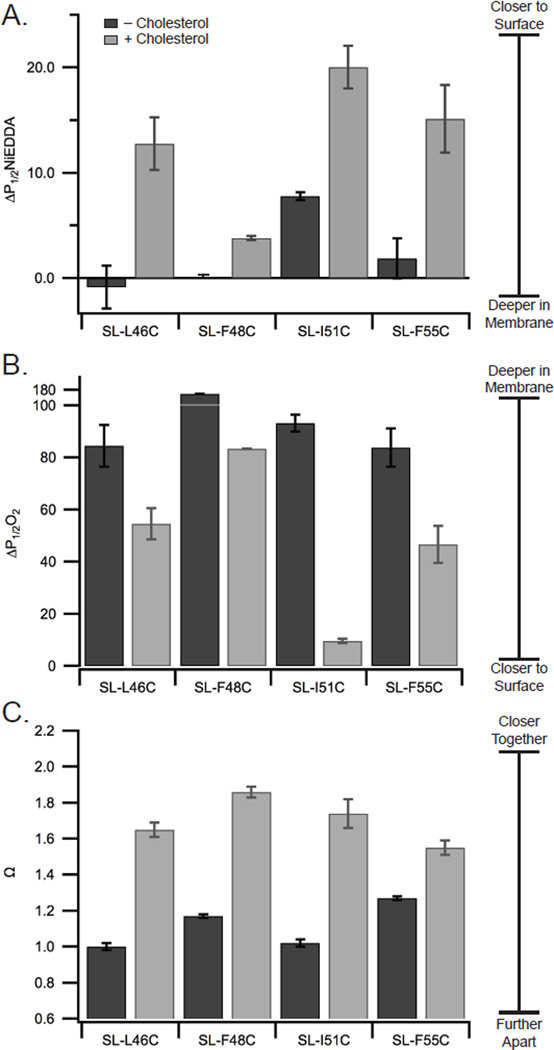
Figure 6. Addition of cholesterol changes the membrane topology of the C-terminal juxtamembrane region.
Accessibility data to NiEDDA (A) and oxygen (B), and interaction parameter (Ω) data (C) for M2TMC labeled at the indicated sites in POPC:POPG (4:1) bilayers with 0% and 30% cholesterol. Ω is the ratio of the central line intensity for fully-labeled and spin-diluted samples. Spectra used to calculate Ω are shown in Figure S2.

