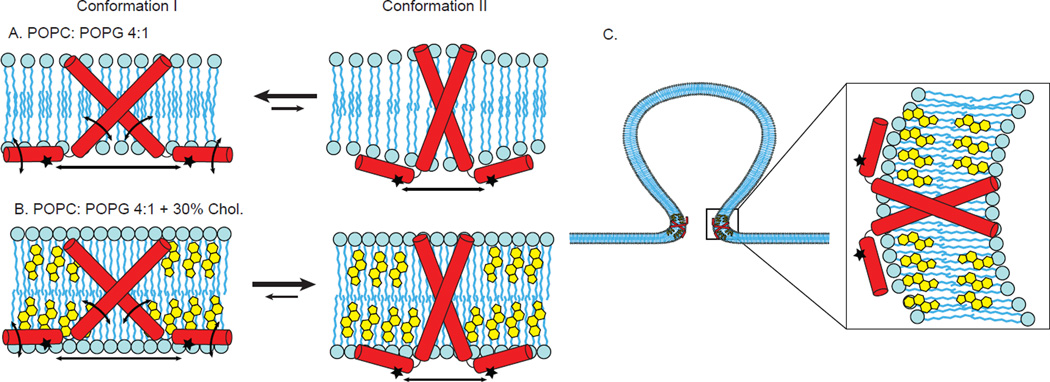
Figure 8. Cartoon model that is consistent with experimental data collected on the C-terminal amphipathic helices of M2.
Conformation I (left in Figure 8A,B), and Conformation II (right in Figure 8A,B). As compared to Conformation I, the C-terminal helices of Conformation II are less mobile, less deep in the membrane and closer together within the homotetramer. A. In the absence of cholesterol, both Conformation I and Conformation II are present, but the equilibrium is shifted towards Conformation I. B. In the presence of cholesterol, both Conformation I and Conformation II are present, but cholesterol preferentially stabilizes Conformation II and the equilibrium is shifted towards Conformation II. C. We postulate that in the highly curved region of the neck of viral budding where cholesterol is concentrated, Conformation II is predominant. For clarity, only two of the four subunits of a M2 homotetramer are shown in the cartoon models.

