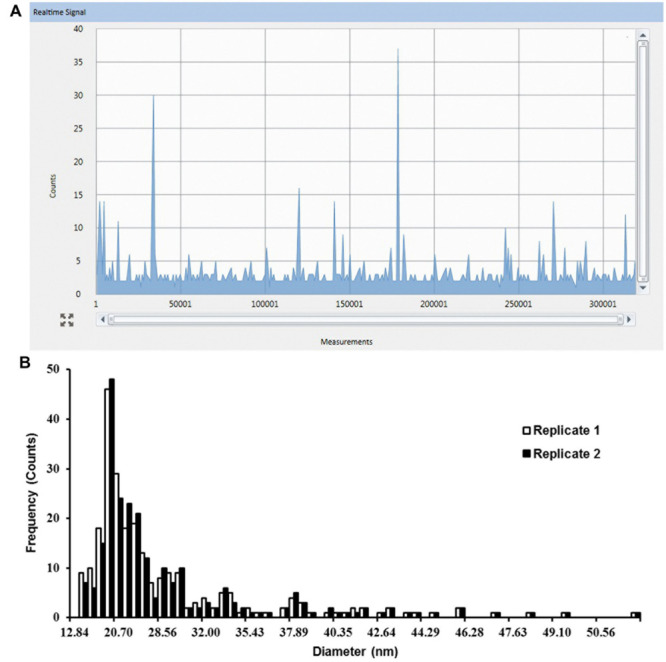
FIGURE 2.

Single particle-inductively coupled plasma-mass spectrometry (SP-ICP-MS) analysis of internalized Ag NPs in root tissues of Arabidopsis plants exposed to 0.02 mg/L 10 nm Ag NPs for 2 weeks. (A) Raw counts for Ag NPs detected from replicate 1 and (B) derived size distribution histogram of Ag NPs for two biological replicates.
